Author Archives: Barry M. Wise

About Barry M. Wise

Co-founder, President and CEO of Eigenvector Research, Inc. Creator of PLS_Toolbox chemometrics software.

By Popular Demand: EigenU Online

Jun 22, 2012

At the last several editions of Eigenvector University (aka EigenU) our beginning track courses have been consistently overbooked. This includes the first three days of courses consisting of Linear Algebra for Chemometricians, MATLAB for Chemometricians, Chemometrics I: PCA, and Chemometrics II: Regression and PLS. There were also EigenU attendees with schedule conflicts that made it impossible for them to attend some of these courses, but they needed the background to attend other EigenU courses.

Therefore, due to popular demand, we’ve created EigenU Online. EigenU Online allows users to get chemometrics training on their own schedule and at their own desk. The material covered is the same as in their EigenU counterparts. Courses consist of video lectures using both slides and software demonstrations, plus course notes in .pdf format. Additional materials and data sets are included for some courses.

The goal of the EigenU Online courses is to provide students the background they’ll need to understand the chemometric methods presented and accomplish typical modeling tasks in PLS_Toolbox and Solo. But, like our EigenU courses, they aren’t just about using software! No matter whose software you use, you’ll be a better user after EigenU Online.

We’ve made a couple segments of our online courses available free for your evaluation. Just login to your Eigenvector account, or create one. Under the EigenU Online tab you’ll see a link to the lecture Classical Least Squares – Introduction, and to Classical Least Squares – Hands-on Example which shows how the course software demonstrations work.

For complete information, see the EigenU Online page. Still have questions? Write to me at bmw@eigenvector.com.

BMW

EigenU 2012 Poster Session Winners

May 21, 2012

EigenU 2012, the Seventh Annual Eigenvector University, was held last week at the Washington Athletic Club in Seattle. Our Tuesday evening PLS_Toolbox/Solo User poster session gave EigenU attendees a chance to unwind with hors d’oeuvres and beverages and discuss some chemometric applications. This year’s posters were judged by Paul Geladi, professor of Chemometrics at SLU, the Swedish University of Agricultural Sciences.

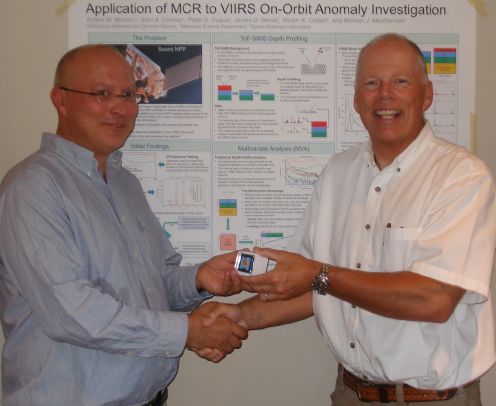
Bob Moision of Aerospace Corp. claimed first prize with “Application of MCR to VIIRS On-Orbit Anomaly Investigation.” Bob’s poster described how multivariate analysis was used with ToF-SIMS data in an investigation into the cause of the unexpected poor sensitivity of the Visible/Infrared Imager Radiometer Suite (VIIRS) on the Suomi National Polar-orbiting Partnership satellite. Bob is show below accepting his Apple iPod nano.

Bob Moision recieves EigenU Poster Prize

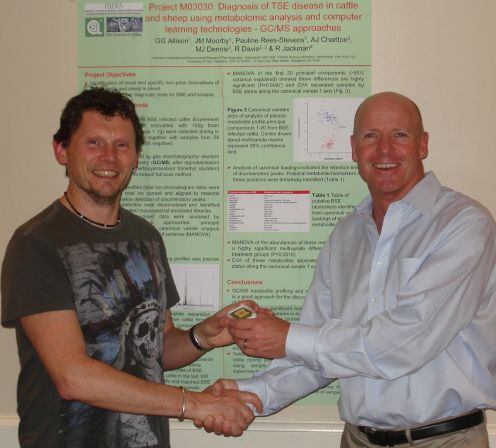
Second prize was awarded to Gordon Allison of Aberystwyth University for “Diagnosis of TSE disease in cattle and sheep using metabolomic analysis and computer learning technologies- GC/MS approaches.” The poster summarized results of a project aimed to identify novel, non-prion markers of transmissible spongiform encephalopathy (TSE) disease in samples of blood plasma from infected cattle and sheep that consistently indicate infection and which could be used for disease diagnosis in living animals before the appearance of clinical symptoms. Gordon is shown below accepting his nano from Eigenvector Vice-President Neal Gallagher.

Gordon Allison receives EigenU Best Poster Prize

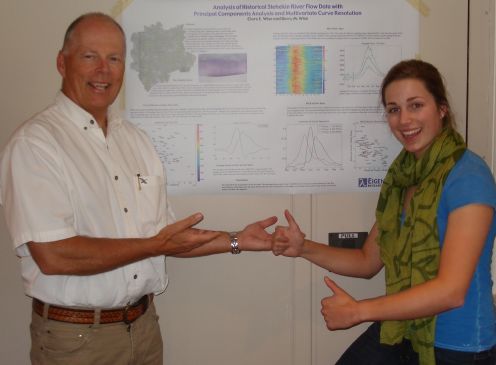
This year’s poster session included a father-daughter project: Clare Wise presented “Analysis of Historical Stehekin River Flow Data with Principal Components Analysis and Multivariate Curve Resolution.” The poster described how PCA and MCR can be used on the daily Stehekin River flow data to model spring runoff and to find interesting years since measurements were started in 1927. Clare, who will be a freshman in Chemical and Biological Engineering at the University of Colorado next fall, is shown with her poster, and me, below.

Thanks to everyone who presented and attended this year’s poster session!

BMW

iPods Ordered!

Apr 27, 2012

The Seventh Annual Eigenvector University starts in just over two weeks on Sunday, May 13, 2012. We’re looking forward to a busy week, including the PLS_Toolbox/Solo User Poster Session. This Tuesday evening event showcases research done by our users. Presenters of the two best posters go home with Apple iPod nanos. I ordered them today, both 16GB, one orange, one blue, and both engraved with “EigenU 2012 Best Poster.”

The complimentary poster session is always a great time for EigenU participants to relax, have a beverage, and talk about chemometric applications. Attendance at EigenU courses is not required to present a poster, and we often get grad students from University of Washington and other Seattle area research centers.

Interested in presenting? Just send an abstract for your poster that describes work where you’ve used our software.

See you in a couple weeks!

BMW

Top 10 Reasons to come to EigenU 2013

Apr 4, 2012

If you are in the market for training in multivariate methods you have a number of choices. In North America, you could attend classes given by CAMO, ProSensus, or Umetrics. Here are 10 reasons you should come to the 8th Annual EigenU 2013, May 12-17 in Seattle, instead:

  1. More experienced instructors – Courses at EigenU 2013 will be led by the EVRI staff including Neal B. Gallagher, Jeremy M. Shaver, Robert T. Roginski, and Randy Bishop, plus our Associate Rasmus Bro, and of course myself. Together we’ve got over 100 man-years of chemometric experience.
  2. Wider variety of courses – In addition to our beginning track including PCA and PLS, we offer 11 advanced and specialty courses including Robust Methods, Calibration Transfer/Instrument Standardization, Batch SPC, Variable Selection and Multivariate Image Analysis. Plus new this year, we have the Bring Your Own Data (BYOD) Workshop where you’ll be able to work with your own data while you learn hands-on with EVRI’s team of instructors.
  3. Method-centric instruction – At EigenU we provide the background required to truly understand chemometric methods; we don’t just show you what buttons to push. Our goal is to make the literature in the field accessible to our graduates. Deeper understanding of the methods leads to better analysis!
  4. Beautiful Seattle, WA – With Puget Sound and the Olympics to the West and Lake Washington and the Cascades to the East, the Emerald City is distractingly scenic. Plus, it is home to the Space Needle, Pike Place Market, Seattle Art Museum, Seattle Mariners, the largest ferry system in the US, plus tons of other attractions. It is definitely not New Jersey!
  5. The Washington Athletic Club – EigenU is held at the WAC, the nation’s premier city athletic club. The historic 21 story facility includes 5 floors of fitness facilities, 10 floors of Euro-styled techno-centric sleeping rooms, full service spa, and 3 restaurants.
  6. The food – From the continental breakfast, including the WAC’s signature sticky buns, through the gourmet plated lunches, to afternoon snack bars, our guests always rave about the food.
  7. Networking – EigenU attendance is typically about 40 scientists and engineers with a range of chemometric expertise and wide variety of interests. This means you’ll have plenty of opportunity to find colleagues with common problems and complimentary solutions.
  8. Evening events – EigenU provides ample opportunity to continue your chemometric learning and networking into the evening. This includes Tuesday’s PLS_Toolbox/Solo User Poster Session, Wednesday’s PowerUser Tips & Tricks Session, and Thursday’s Workshop Dinner, which is one more opportunity to enjoy the WAC’s fabulous food. Present a poster at the Tuesday evening User Session and you could win an Apple iPad mini or iPod nano!
  9. Flexible, multi-platform software – With PLS_Toolbox, MIA_Toolbox and EMSC_Toolbox, EVRI offers the most comprehensive set of chemometric tools available plus the flexibility of MATLAB. Our stand-alone packages Solo and Solo+MIA offer all the point and click tools of their MATLAB-based siblings. Plus they’re all available for Windows, Linux and MacOS. On-line options available too!
  10. Costs less – In spite of all its advantages, EigenU actually costs less than similar courses from CAMO, Umetrics and ProSensus.

So it probably isn’t surprising that EigenU attendees are more than satisfied. Here’s what a couple of them had to say:

“I attended the Eigenvector University 2010 earlier this year. It was the best short-course I have ever taken on any subject. I highly recommend it if you’re looking for a short-course, immersion kind of training.” – James M. Roberts, GSK

“What you are offering here is unmatched.” – David A. Russell, Dupont.

Discount registration ends soon, register and pay by April 10 for the best prices.

See you at EigenU!

BMW

New Releases: PLS_Toolbox and Solo 6.7, MIA_Toolbox 2.7

Mar 20, 2012

Updates to our flagship PLS_Toolbox and Solo were released last week; they are now in version 6.7. This is in keeping with our policy, (began in 2008), to release significant upgrades twice yearly. Our Multivariate Image Analysis (MIA) tools were also updated with the release of Solo+MIA 6.7 and MIA_Toolbox 2.7.

As the Version 6.7 Release Notes show, the number of additions, improvements and refinements is (once again!) rather long. My favorite new features are the Drag and Drop import of data files, Confusion Table including cross-validation results for classification problems, and Custom Color-By values for plotting.

PLS_Toolbox/Solo can import a wide variety of file types, and the list continues to grow. Drag and Drop importing allows users to drag their data files directly to the Browse or Analysis windows. They will be loaded and ready for analysis. For instance, users can drag a number of .spc files directly into Analysis. Forget some files or have additional files in a different directory? Just drag them in and they will be augmented onto the existing data.

The Confusion Table feature creates several tables summarizing the classification performance of models. This includes a “confusion matrix” giving fractions of true positive, false positive, true negative, and false negative samples and a confusion table which gives number of samples the actual and predicted classes. Tables are calculated for both the full fitted model and for the cross-validation results. The tables can be easily copy and pasted, saved to file, or can be included in the Report Writer output as html, MS Word or PowerPoint files.

With Custom Color-By users can color points in scores and loadings plots using any currently loaded data or with new data loaded from the workspace. For instance, samples in a PLS LV-2 versus LV-1 scores plot can be colored by the scores on another LV, their actual or predicted y values, leverage, Q residual, specific X-variable, additional Y-variable, or any custom variable from the work space. The allows deeper investigation into the cause of specific variations seen in the data.

Want to find out more about our latest releases? Create an account in our system and you’ll be able to download free 30-day demos. Want prices? No need to sit through a webinar! Just check our price list page, which includes all our products. Just click Academic or Industrial.

As always, users with current Maintenance Agreements can download the new versions from their accounts.

Questions? I’d be happy to answer them or refer you to our development team. Just email me!

BMW

Cross-validation Explained

Feb 27, 2012

I was recently teaching a chemometrics course with Rasmus Bro when he was asked to explain cross-validation. Rasmus sketched up an example to explain it, and I was inspired by that to turn it into a more formal movie. Just click on the link below to view it. Enjoy!

Cross_Validation_Explained

BMW

EigenU Registrations Coming In!

Jan 23, 2012

Registrations have started coming in for Eigenvector University 2012. This seventh annual EigenU will be May 13-18 at the Washington Athletic Club in Seattle.

New for this year, Batch Multivariate Statistical Process Control for PAT combines the technical aspects of developing chemometric models for monitoring batch processes with the practical aspects of implementing and deploying models, particularly in the pharmaceutical industries. Our DOE course, which debuted last year, has been updated and expanded to become Design of Experiments for QbD (Quality by Design). Also updated this year, Advanced Preprocessing for Spectral Applications has been refocused on spectroscopy.

The PLS_Toolbox/Solo User Poster Session returns with Apple iPod prizes for the two best posters. New and advanced features of our software will be highlighted in the PowerUser Tips & Tricks evening session. And of course our traditional group dinner will be held at Torchy’s in the WAC.

Our most popular classes usually fill up, so register early! Discount registration rates apply for registrations received with payment by April 11, 2012.

See you in Seattle!

BMW

PLS_Toolbox in Research and Publications

Dec 6, 2011

Our Chief of Technology Development Jeremy M. Shaver received a very nice letter this morning from Balázs Vajna, who is a Ph.D. student at Budapest University of Technology and Economics. As you’ll see from the references below, he is a very productive young man! Here is his letter to Jeremy, highlighting how he used PLS_Toolbox in his work:


Dear Jeremy,

I would like to thank you for all your help with the Eigenvector products. With your help, I was able to successfully carry out detailed investigations using chemical imaging and chemometric evaluation in such a way that I could publish these results in relevant international journals. I would like to draw your attention to the following publications where (only) PLS_Toolbox was used for chemometric evaluation:

  1. B. Vajna, I. Farkas, A. Farkas, H. Pataki, Zs. Nagy, J. Madarász, Gy. Marosi, “Characterization of drug-cyclodextrin formulations using Raman mapping and multivariate curve resolution,” Journal of Pharmaceutical and Biomedical Analysis, 56, 38-44, 2011.
  2. B. Vajna, H. Pataki, Zs. Nagy, I. Farkas, Gy. Marosi, “Characterization of melt extruded and conventional Isoptin formulations using Raman chemical imaging and chemometrics,” International Journal of Pharmaceutics, 419, 107-113, 2011.

These may be considered as showcases of using PLS_Toolbox in Raman chemical imaging, and – which is maybe even more interesting in the light of your collaboration with Horiba Jobin Yvon – the joint use of PLS_Toolbox and LabSpec. The following studies have also been published where MCR-ALS and SMMA (Purity) were carried out with PLS_Toolbox and were tested along with other curve resolution techniques.

  1. B. Vajna, G. Patyi, Zs. Nagy, A. Farkas, Gy. Marosi, “Comparison of chemometric methods in the analysis of pharmaceuticals with hyperspectral Raman imaging,” Journal of Raman Spectroscopy, 42(11), 1977-1986, 2011.
  2. B. Vajna, A. Farkas, H. Pataki, Zs. Zsigmond, T. Igricz, Gy. Marosi, “Testing the performance of pure spectrum resolution from Raman hyperspectral images of differently manufactured pharmaceutical tablets,” Analytica Chimica Acta, in press.
  3. B. Vajna, B. Bodzay, A. Toldy, I. Farkas, T. Igricz, G. Marosi, “Analysis of car shredder polymer waste with Raman mapping and chemometrics,” Express Polymer Letters, 6(2), 107-119, 2012.

I just wanted to let you know that these publications exist, all using PLS_Toolbox in the evaluaton of Raman images, and that I am very grateful for your help throughout. I hope you will find them interesting.

Best regards,

Balázs

Balázs Vajna
PhD student
Department of Organic Chemistry and Technology
Budapest University of Technology and Economics
8 Budafoki str., H-1111 Budapest, Hungary


Thanks, Balázs, your letter just made our day! We’re glad you found our tools useful!

BMW

Missing Data (part three)

Nov 21, 2011

In the first and second installments of this series, we considered aspects of using an existing PCA model to replace missing variables. In this third part, we’ll move on to using PLS models.

Although it was shown previously that PCA can be used to perfectly impute missing values in rank deficient, noise free data, it’s not hard to guess that PCA might be suboptimal with regards to imputing missing elements in real, noisy data. The goal of PCA, after all, is to estimate the data subspace, not predict particular elements. Prediction is typically the goal of regression methods, such as Partial Least Squares. In fact, regression models can be used to construct estimates of any and all variables in a data set based on the remaining variables. In our 1989 AIChE paper we proposed comparing those estimates to actual values for the purpose of fault detection. Later this became known as regression adjusted variables, as in Hawkins, 1991.

There is a little known function in PLS_Toolbox, (since the first version in 1989 or 90), plsrsgn, that can be used to develop collections of PLS models, where each variable in a data set is predicted by the remaining variables. The regression vectors are mapped into a matrix that generates the residuals between the actual and predicted values in much the same way as the IPP‘ matrix from PCA.

We can compare the results of using these collections of PLS models to using the PCA done previously. Here we created the coeff matrix using (a conservative) 3 LVs in each of the PLS submodels. Each sub model could of course be optimized individually, but for illustration purposes this will be adequate. The reconstruction error of the PLS models is compared with PCA in the figure shown at left, where the error for the collection of PLS models is shown in red, superimposed over the reconstruction via the PCA model error, in blue. The PLS models’ error is lower for each variable, in some cases, substantially, e.g. variables 3-5.

The second figure, at left, shows the estimate of variable 5 for both the PLS (green) and PCA (red) methods compared to the measured values (blue). It is clear that the PLS model tracks the actual value much better.

Because the estimation error is smaller, collections of PLS models can be much more sensitive to process faults than PCA models, particularly individual sensor faults.

It is also possible to replace missing variables based on these collections of PLS models in (nearly) exactly the same manner as in PCA. The difference is that, unlike in PCA, the matrix which generates the residuals is not symmetric, so the R12 term (see part one) does not equal R21‘. The solution is to calculate b using their average, thus

b = 0.5(R12 + R21‘)R11-1

Curiously, unlike the PCA case, the residuals on the replaced variables will not be zero except in the unlikely case that R12 = R21‘.

In the case of an existing single PLS model, it is of course possible to use this methodology to estimate the values of missing variables based on the PLS loadings. (Or, if you insist, on the PLS weights. Given that residuals based on weights are larger than residuals based on loadings, I’d expect better luck reconstructing from the loadings but I offer that here without proof.)

In the next installment of this series, we will consider the more challenging problem of building models on incomplete data records.

BMW

B.M. Wise, N.L. Ricker, and D.J. Veltkamp, “Upset and Sensor Failure Detection in Multivariate Pocesses,” AIChE Annual Meeting, 1989.

D.M. Hawkins, “Multivariate Quality Control Based on Regression Adjusted Variables,” Technometrics, Vol. 33, No. 1, 1991.

2011 EAS Awards for NIR and Chemometrics

Nov 17, 2011

I had the privilege of being involved with two award sessions at this week’s Eastern Analytical Symposium (EAS). I was very pleased to be invited to speak in the session honoring former Eigenvectorian Charles E. “Chuck” Miller for Outstanding Achievements in Near Infrared Spectroscopy. Chuck elected to have talks from speakers that represented phases in his career. This included Robert Thompson, Chuck’s advisor from Oberlin College, Tormod Næs, from his time at University of Washington’s Center for Process Analytical Chemistry (CPAC) and Matforsk (now Nofima), Cary Sohl of DuPont, and myself. Chuck, now with Merck, presented “26 Years of NIR Technology – From One Person’s Perspective,” which chronicled his career and influences, along with the progression of NIR over the period.

The session was organized by Katherine Bakeev of CAMO. Pictured below are Katherine, Tormod, Cary, Chuck, EAS President David Russell, and myself.

The session provided ample evidence of the intertwined evolution of chemometrics and NIR, with two primarily chemometric talks and two NIR talks with aspects of chemometrics.

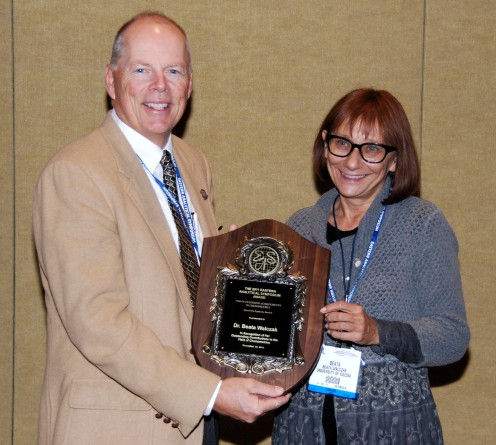
I was also our representative at the session honoring Beata Walczak of the University of Silesian in Poland. Beata was the recipient of the EAS Award for Outstanding Achievements in Chemometrics, sponsored once again by Eigenvector Research. Beata and I are pictured below with the award.

The award session, organized by Peter D. Wentzell of Dalhousie University, had an “omics” theme with talks on metabolomics and proteomics. Speakers included Peter, Tobais Karakach of the Institute for Marine Biosciences, Sarah Rutan of Virginia Commonwealth University and Michal Daszykowski, also of Silesian. Beata presented “Chemometrics in Proteomics,” an overview of her work in the field highlighting methods for aligning samples from 2-D gel electrophoresis.

Congratulations to both Chuck and Beata on two very well-deserved awards!

BMW

Missing Data (part two)

Nov 11, 2011

In Missing Data (part one) I outlined an approach for in-filling missing data when applying an existing Principal Components Analysis (PCA) model. Let us now consider when this approach might be expected to fail. Recall that missing data estimation results in a least-squares problem with solution:

xb = –xgR21R11-1

In our short courses, I advise students to be wary any time a matrix inverse is used, and this case is no exception. Inverses are defined only for matrices of full rank, and may be unstable for nearly rank-deficient matrices. So under what conditions might we expect R11 to be rank deficient? Recall that R11 is the part of IPP‘ that applies to the variables which we want to replace. Problems arise when the variables to be replaced form a group that are perfectly correlated with each other but not with any of the remaining variables. When this happens the variables will either be 1: included as a group in the PCA model (if enough PCs are retained) or 2: excluded as a group (too few PCs retained). In case 1, R11 is rank deficient and the inverse isn’t defined. In case 2, R11 is just I, but the loadings of the correlated group are zero, so the R12 part of the solution is 0. In either case, it makes sense that a solution isn’t possible–what information would it be based on?

With real data, of course, it is highly unlikely that R11 will be rank deficient to within numerical precision (or that R12 will be zero). But it certainly may happen that R11 is near rank deficient, in which case the estimates of the missing variables will not be very good. Fortunately, in most systems the measured variables are somewhat correlated with each other and the method can be employed.

In their 1995 paper, Nomikos and MacGregor estimated the value of missing variables using a truncated Classical Least Squares (CLS) formulation. The PCA loadings are fit to the available data, leaving out the missing portions, to estimate scores which are then used to estimate missing values. This reduces to:

xb = xg(PgPg‘)-1PgPb

where Pb and Pg refer to the part of the PCA model loadings for the missing (bad) and available (good) data, respectively. In 1996 Nelson, Taylor and MacGregor noted that this method was equivalent to the method in our 1991 paper but offered no proof. The proof can be found in “Refitting PCA, MPCA and PARAFAC Models to Incomplete Data Records” from FACSS, 2007.

So how does this work in practice? The topmost figure shows the estimation error for each of the 20 variables in the melter data based on a 4 PC models with mean-centering. The model was estimated with every other sample and tested on the other samples. The estimation error is shown in units of Relative Standard Deviation (RSD) to the raw data. Thus, the variables with error near 1.0 aren’t being predicted any better than just using the mean value, while the variables with error below 0.2 are tracking quite well. An example is shown in the middle figure, which shows temperature sensor number 8 actual (blue line) and predicted (red x) for the test set as a function sample number (time).

The reason for the large differences in ability to replace variables in this data set is, of course, directly related to how independent the variables are. A graphic illustration of this can be produced with the PLS_Toolbox corrmap function, which produced the third figure. The correlation matrix for the temperatures is colored red where there is high positive correlation, blue for negative correlation, and white for no correlation. It can be seen that variables with low estimation error (e.g. 7, 8, 17, 18) are strongly correlated with other variables, whereas variables with high estimation error (e.g. 2, 12) are not correlated strongly with any other variables.

To summarize, we’ve shown that missing variables can be imputed based on an existing PCA model and the available measurements. This success of this approach depends upon the degree to which the missing variables are correlated with available variables, as might be expected. In the next installment of this Missing Data series, we’ll explore using regression models, particularly Partial Least Squares (PLS) to replace missing data.

BMW

P. Nomikos and J.F. MacGregor, “Multivariate SPC Charts for Monitoring Batch Processes,” Technometrics, 37(1), pps. 41-58, 1995.

P.R.C. Nelson, P.A. Taylor and J.F. MacGregor, “Missing data method in PCA and PLS: Score calculations with incomplete observations,” Chemometrics & Intell. Lab. Sys., 35(1), pps. 45-65, 1996.

B.M. Wise, “Re-fitting PCA, MPCA and PARAFAC Models to Incomplete Data Records,” FACSS, Memphis, TN, October, 2007.

What’s in a Logo?

Nov 7, 2011

Branding is an important aspect of promoting a business and central to that is developing an identifiable logo. I like logos, (and sometimes wish I could be a graphic designer). The best logos, besides looking great, have a deep connection to the thing they represent. Coming up with a good one is quite an exercise.

When Eigenvector was working on a new website design in ~1998 we hired Chris Raines of Sun Graphic and now Cevado. Chris thought that we should first design a new logo and started by asking questions about what we do and how we got the name Eigenvector. I explained that we basically analyzed large tables of data, i.e. big matrices, and that Eigenvectors were central to the types of analysis we do. Besides, I’d always liked the idea that an eigenvector was a “proper” direction in a data analysis problem, and I like to think that we are moving our clients in the “proper” direction. I then wrote down the equation Ax = λx. Pointing to the Greek letter lambda, Chris asked, “What’s the swoopy thing?” I replied, “Generally, people use lambda to represent the eigenvalue in the eigenvector equation.” Chris said, “We have to use the swoopy thing!”

From that, Chris produced the logo that we use today, shown above. The four by four set of boxes represent a matrix, and the “swoopy thing” the matrix eigenvalue(s). Eigenvalues, more than any other parameters, describe the structure of matrices, and are important in our work. When we need a roughly square logo, we put “Eigenvector” on the bottom and “Research” up the side, like a matrix outer product. We use outer products all the time to analyze and approximate matrices as in Principal Components Analysis (PCA).

So what’s in a logo? If it’s a good one, quite a lot!

BMW

Missing Data (part one)

Nov 5, 2011

Over the next few weeks I’m going to be discussing some aspects of missing data. This is an important aspect of chemometrics as many applications suffer from this problem. Missing data is especially common in process applications where there are many independent sensors.

I got interested in missing data while in graduate school in the late 1980s. I worked a lot with a prototype glass melter for the solidification of nuclear fuel reprocessing waste. The primary measurements were temperatures provided by thermocouple sensors. The very high temperatures in this system, nearing 1200C (~2200F), caused the thermocouples to fail frequently. Thus it was common for the data record to be incomplete.

Missing data is also common in batch process monitoring. There are several approaches for building models on complete, finished batches. However, it is most useful to know if batches are going wrong BEFORE they are complete. Thus, it is desirable to be able to apply the model to an incomplete data record.

Missing data problems can be divided into two classes: 1)those involving missing data when applying an existing model to new data records, and 2) those involving building a model on an incomplete data record. Of these, the first problem is by far the easiest to deal with, so we will start with it. It will, however, illustrate some approaches which can be modified for use in the second case. These approaches can also be used for other purposes as well, such as cross-validation of Principal Component Analysis (PCA) models.

Consider now the case where you have a process that periodically produces a new data vector xi (1 x n). With it you have a validated PCA model, with loadings Pk (n x k). The residual sum-of-squares or Q statistic, can be calculated for the ith sample as Q = xiRxi‘ where R = IPkPk‘. For the sake of convenience, imagine that the first p variables in this model are no longer available, but the remaining np variables are as usual. Thus, x can be partitioned into a group of bad variables xb and a group of good variables xg, x = [xb xg]. The calculation of Q can then be broken down into parts which do and do not involve missing variables:

Q = xbR11xb‘ + xgR21xb‘ + xbR12xg‘ + xgR22xg

where R11 is the upper left (p x p) part of R, R12 = R21‘ is the lower left (np x p) section, and R22 is the lower right (np x np) section.

It is possible to solve for the values of the bad variables xb that minimize Q, as shown in our 1991 paper referenced below. The (incredibly simple) solution is

xb = –xgR21R11-1

Unsurprisingly, the residuals on the replaced variables on the full model will be zero.

This method is the basis of the PLS_Toolbox function replace, which maps the solution above into a matrix so variables in arbitrary positions can be replaced.

It is easy to demonstrate that this method works perfectly in the rank deficient, no noise case. In MATLAB, you can create a rank 5 data set with 20 variables, then use the Singular Value Decomposition (SVD) to get a set of PCA loadings P, and from that, the R matrix.

>> c = randn(100,5);
>> p = randn(20,5);
>> x = c*p’;
>> [u,s,v] = svd(x);
>> P = v(:,1:5);
>> R = eye(20)-P*P’;

Now let’s say the sensor associated with variable 5 has failed. We can use the replace function to generate a matrix Rm which replaces it based on the values of the other variables.

>> Rm = replace(R,5,’matrix’);
>> imagesc(sign(Rm)), colormap(rwb)

Rm has the somewhat curious structure show in the figure above. The white area is zeros, the diagonal is ones, and R21R11-1 for the appropriately rearranged R is mapped into the vertical section.
We can try Rm out on a new data set that spans the same space as the previous one, and plot up the results as follows:

>> newx = randn(100,5)*p’;
>> var5 = newx(:,5);
>> newx(:,5) = 0;
>> newx_r = newx*Rm;
>> figure(2)
>> plot(var5,newx_r(:,5),’+b’), dp

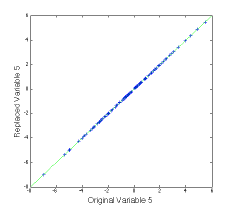
The (not very interesting) figure at left shows that the replaced value of variable 5 agrees with the original value. This can be done for multiple variables.

In the second installment of this Missing Data series I’ll give some examples of how this works in practice, discuss limitations, and show some alternate ways of estimating missing values. In the third installment we’ll get to the much more challenging issue of building models on incomplete data sets.

BMW

B.M. Wise and N.L. Ricker, “Recent advances in Multivariate Statistical Process Control, Improving Robustness and Sensitivity,” IFAC Symposium n Advanced Control of Chemical Processes, pps. 125-130, Toulouse, France, October 1991.

PLS_Toolbox/Solo Advanced Features in NJ

Nov 2, 2011

Eigenvector Vice-president Neal B. Gallagher and Chief of Technology Development Jeremy M. Shaver will present Using the Advanced Features in PLS_Toolbox/Solo 6.5 in New Brunswick, NJ on December 8-9, 2011. The course will be held at the Hyatt Regency.

With PLS_Toolbox and Solo Version 6.5 released last month, this is an opportune time to attend this course. Participants will learn how to take advantage of many of the recently added tools. It will also be a great time to ask “how to” type questions. Nobody knows our software more intimately than Jeremy, as he is responsible for its overall development. He’s constantly surprising the rest of us EigenGuys by showing us easier ways to accomplish our modeling tasks using features we didn’t know existed! Neal will be on hand to guide users through many of the methods, particularly the advanced preprocessing features. Neal has extensive experience in this area due to his work with remote sensing applications.

The course includes an optional second half day which covers our tools for Multivariate Image Analysis and Design of Experiments. There will also be time for one-on-one consulting with the software. Attendees are encouraged to bring their own data for this! Often all the methods and tools make a lot more sense when applied to data with which you are familiar.

If you have any questions about this course or our other course offerings, such as EigenU, please write to me.

BMW

FOSS Course Conclusion

Oct 27, 2011

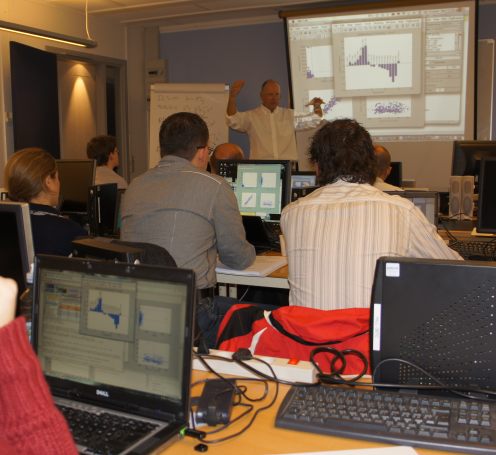
Our Basic/Intermediate Chemometrics course at FOSS in Hillerød, Denmark, concluded today. It has been a good week; Rasmus and I have really enjoyed it. We’ve had lots of good discussion with plenty of examples offered by class members. And our students have been very attentive–note that they have the same thing on their screens as I have on mine!

Many thanks to FOSS and especially Lars Nørgaard for inviting us here. FOSS took good care of us, providing ample coffee, great snacks for breaks, and great lunches in their cafeteria. We’ve also had a couple nice evenings out, including a very nice dinner at Ristorante La Perle. We can see why everybody in Hillerød goes there for their birthday.

Thanks to everyone who attended!

BMW

Off to Hillerød

Oct 20, 2011

I’m leaving in the morning to go to Hillerød, Denmark, where we are holding a Beginning/Intermediate Chemometrics course. I’ll be teaching with Rasmus Bro, which I always enjoy. Rasmus has a very relaxed lecturing style and is very good at explaining chemometric concepts. I always learn something, even when it is about subjects I’m already pretty good at.

The course will be held at FOSS World Headquaters. FOSS is very big in applications of spectroscopy to problems in food and beverages, grain, feed, meat etc. Chemometrics is a critical part of this and FOSS has a substantial chemometrics group. That group is headed up by Lars Nørgaard, the former Head of the Department of Food Science at University of Copenhagen.

I think of Lars more as a chemometrician, however, rather than a manager. PLS_Toolbox owes a number of things to Lars, including Inteval-PLS (iPLS) and ‘color-by.’ iPLS is a method for selecting variables and also elucidating from which part of the spectrum calibration models get their predictive information. The ‘color-by’ feature uses the color of data points in a plot to indicate the value of another variable. It really helps spot trends. I first saw this feature in LatentiX, with which Lars was involved.

We have a nearly full class lined up and with Lars, Rasmus and myself it should make for a lively group. Plus, we’ll be teaching with the just released PLS_Toolbox 6.5. I’ll need to spend some time learning about 6.5’s new features myself. I’m looking forward to it!

BMW

Multi-platform Chemometrics Software

Oct 14, 2011

When I go to conferences I often look around to see what sort of computers people are using. In the past year or so I’ve noticed a significant uptick in the number of Macs. At SSC-12, SIMS-XVIII and FACSS/SCIX-2011 Macs accounted for about half of the laptops that I saw in use in the technical sessions and the trade shows.

So, who is making chemometrics software for anything besides Windows? Umetrics isn’t. SIMCA is Windows only. CAMO isn’t. Unscrambler® X is Windows only. Infometrix isn’t. Pirouette® is Windows only. The answer, of course, is Eigenvector Research. Because MATLAB® is available on all platforms, EVRI’s flagship PLS_Toolbox, plus our MIA_Toolbox and EMSC_Toolbox work on Mac OS X, Linux and Windows too. And that includes the 64-bit versions!

Don’t have MATLAB? Not a problem. Our stand-alone packages Solo and Solo+MIA also run on all platforms, including the 64-bit versions. Even our on-line prediction engine, Solo_Predictor, runs on all platforms.

So, besides the fact that PLS_Toolbox and Solo support a wider array of chemometric methods and preprocessing options, and the fact that their point-and-click interfaces are highly intuitive, you can add the fact that they run on more than just Windows. And as if that weren’t enough, they also cost less.

So if you are looking for great chemometrics software that runs in a multi-platform environment, EVRI has solutions for you!

BMW

Unscrambler® is a registered trademark of CAMO, Inc.
Pirouette® is a registered trademark of Infometrix, Inc.
MATLAB® is a registered trademark of The MathWorks, Inc.

Report from FACSS

Oct 6, 2011

This year’s Federation of Analytical Chemistry and Spectroscopy Societies meeting (FACSS) was quite vibrant. The number of participants was up from recent years, with close to 1200 registrants. Attendance at the technical sessions and traffic at the exhibit was good.

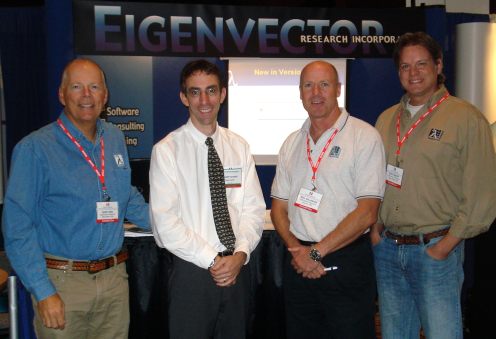
As usual, EVRI was there in force. Our booth crew is shown above, including me, Chief of Technology Development Jeremy M. Shaver, Vice-President Neal B. Gallagher, and Senior Research Scientist Randy Bishop.

We especially enjoyed the Monday evening reception, where we gave away beer in our Eigenvector logo bottle koozies. Anna Cavinato of Eastern Oregon University is shown at left with a beer and koozie along with all the usual trade show accoutrements (including badge, necklace, wine glass, frisbee, product literature, t-shirt, etc.). We also made sure we were first in line on Tuesday when HORIBA Scientific gave away free hot dogs and beer for lunch.

The organizers of FACSS also announced that the conference name has been changed to SCIX, short for Scientific Exchange. SCIX 2012 will be in Kansas City, Missouri.

As noted in the previous post, the Eigenvectorians also presented four talks, Jeremy co-taught the Analytical Raman Spectroscopy Workshop, Neal co-chaired a session on General Forensics, and Eigenvector sponsored sessions on Chemometrics and Data Fusion and Chemometrics for Process Analysis. On top of that there was booth duty, attending talks, reviewing posters, and the Raman and SAS receptions. It was a busy time!

EVRI would like to thank the organizers of FACSS 2011, especially Exhibits Chair Mike Carrabba, Workshop Chairs Brandye Smith-Goettler and Heather Brooke, and of course Cindi Lilly and her crew. Great meeting! See you next year!

BMW

Off to FACSS, PLS_Toolbox/Solo 6.5

Sep 30, 2011

The Federation of Analytical Chemistry and Spectroscopy Societies (FACSS) annual meeting starts this Sunday, October 2, in Reno, NV. The EVRI crew headed there includes Neal B. Gallagher (NBG), Jeremy M. Shaver (JMS), Randy Bishop (RB), and myself (BMW). We expect to be busy! We have a number of papers to give, listed below.

We’ll also be in the exhibition hall in Booth #29 demoing the soon-to-be released PLS_Toolbox/Solo version 6.5. As usual, our programing team has been very productive, and the list of new features in 6.5 is very long. We’re especially excited about the new Design of Experiments tools and the streamlining and unification of all our Classification Methods. Stop by and have a look, we’d sure like to show you what’s new.

See you there!

BMW

Report from SIMS XVIII

Sep 26, 2011

The eighteenth meeting on Secondary Ion Mass Spectrometry, SIMS XVIII, was held last week in Riva del Garda, Italy. The meeting has been held biannually starting in 1977. As Nicolas Winograd pointed out in the opening lecture, it is a testament to the importance and vibrancy of the field that such a specialized meeting has continued to thrive. SIMS XVIII attracted nearly 400 participants divided roughly equally between Asia, the Americas, and Europe, with Asia being the somewhat largest third and the Americas the smallest.

I was pleased to see an increase in the number of papers that utilized multivariate analysis (MVA) in general and PLS_Toolbox and MIA_Toolbox in particular. In her talk, “Critical Issues in Multivariate Analysis of ToF SIMS Spectra, Images and Depth Profiles,” Bonnie Tyler noted that the number of publications in SIMS utilizing MVA is currently exponentiating, a trend which started about 10 years ago. Interestingly, I first taught a course utilizing SIMS data in 2001 at the Sanibel Island ASMS Meeting. That said, I still saw plenty of presentations and posters with 8-12 images at different AMUs that all looked the same: instances where PCA would result in a drastic reduction in the number of images to review plus some corresponding noise reduction.

Interesting talks where our software was used included:

  • “ToF-SIMS Technique for Nano-Surface Analysis of Biosensors and Tissues” by Tae Geol Lee, Ji-Won Park, Sojeong Yun, Heesang Song, Hyegeun Min, Hyun Jo Jung, Taek Dong Chung, Ki-Chul Hwang, Hark Kyun Kim, Dae Won Moon and Daehee Hwang
  • “Development of ToF-SIMS Enzyme Screening Assays” by Robyn Goacher, Elizabeth Edwards, Charles Mims and Emma Master
  • “Evaluation of white radish sprouts growth influenced by magnetic fields using TOF-SIMS and MCR” by Satoka Aoyagi, Katsushi Kuroda, Ruka Takama, Kazuhiko Fukushima, Isao Kayano, Seiichi Mochizuki and Akira Yano
  • “Multivariate Image Analysis of Chemical Heterogeneities Observed in Microarray Printed Polymers” by David Scurr, Andrew Hook, Daniel Anderson, Robert Langer, Morgan Alexander and Martyn Davies

I presented “Deconvolving SIMS Images using Multivariate Curve Resolution with Contrast Constraints,” by myself and Willem Windig. The talk demonstrated how in MCR contrast can be maximized in either the estimated spectra or concentrations/images. The solutions for each of these cases will give an indication of the range of solutions in the given MCR problem which all fit the data equally well. In many instances, one of the two solutions will be preferred, or both may be interpretable to illustrate different features of the data.

SIMS XVIII also included another installment of our “Chemometrics in SIMS” course. I was happy to present this course to another eager group of future chemometricians!

The SIMS XVIII conference was a great success. The technical program was very interesting and went off without a hitch. Riva del Garda is a beautiful location, perhaps the most scenic conference venue I have experienced. Congratulations to the organizers! I’m already looking forward to SIMS XIX in Jeju Island, Korea in 2013.

BMW