 SEARCH
Category Archives: Chemometrics
EVRI Users Shine in Poster Session at ICNIRS Conference
Aug 3, 2017
Hello EigenFriends and EigenFans,

The ICNIRS conference was held June 11-15 in Copenhagen, Denmark, where close to 500 colleagues gathered for the largest forum on Near-Infared Spectroscopy in the world. The conference featured several keynote lectures, classes taught by EVRI associate Professor Rasmus Bro, and also held several poster sessions where over 20 conference attendees displayed their research using EVRI software! We’d like to feature some of the posters and authors below: thanks for using our software, everyone!
- Y. Allouche, J.A. Fernandez Perna, V. Baeten, & A. Jimenez. “On-line Near Infrared Spectroscopy and Chemometrics for Characterization of Olive Oils at the Exit of a Decanter Centrifuge”
- C. Y. Bastidas, C. von Plessing, J. Troncoso, & R. del Pilar Castillo. “Quantification of an Antibiotic in Salmon Feed Pellets with NIR Spectroscopy and Multivariate Calibration”
- B. Carrasco, D. Vincke, V. Baeten, & J.A. Fernandez Perna. “Application of Near Infrared Spectroscopy and Chemometrics for the Characterization of Complex Mixtures of Food Additives”
- M. Chaudhry, G. Colelli, & M. Amodio.“Potential of Hyperspectral Imaging to Predict Quality and Shelf-Life of Fresh Rocket Leaves to be Used for Fresh-Cut Processing”
- S.Duthen, D. Kleiber, J. Dayde, C. Raynaud, & C. Levasseur-Garcia. “Determination of the Moisture Content of Gelatin Sample”
- D. Eylenbosch, J. A. Fernandez Pierna, V. Baeten, & B. Bodson. “Comparison of PLS and SVM Discriminant Analysis for NIR Hyperspectral Data of Wheat Roots in Soil”
- L. Franca, S. Grassi, M. F. Pimentel, & J. M. Amigo. “Handcraft Beer Monitoring Using NIR Handheld Equipment”
- R. Gasbarrone, S. Serranti & G. Bonifazi. “An Investigation on Non-ferrous Metals Particles Separability from Electronic Scraps using Hyperspectral Imaging and Micro-XRF Analysis”
- S. Montagneir, J. Lallemand, P. Herbert, J. Guilment, & S. Roussel. “Discriminant Strategies for Polymer Identification during Continuous On-line Processes by Near Infrared Spectroscopy”

- R. Palmieri, S. Serranti, G. Bonifazi, & F. Maffei. “Monitoring of Microplastics from Marine Environment Adopting HyperSpectral Imaging”
- J. F. Q. Pereira, C. S. Silva, M. J. Vieira, M. F. Pimentel, A. Braz, & R. S. Honorato. “Evaluation and Identification of Blood Stains in Crime Scenes with Ultra-portable NIR Spectrometer”
- Y. Pu, D. Sun, C. Riccioli, M. Buccheri, M. Grassi, T. M. P. Cattaneo, & A. Gowen. “Calibration Transfer from MicroNIR Spectrometer to Hyperspectral Imaging: A Case Study on Predicting Soluble Solids Content of Bananito Fruit (Musa acuminata)”
- M. M. Reis, I. Kaur, G. Weralupitiya, C. Wang, & M. G. Reis. “Near InfraRed Spectroscopy Applied to Non-invasive Assessment of Physical-chemical Attributes of Dairy Powders”
- R. Rios-Reina, D. L. Garcia-Gonzalez, R. M. Collejon, & J. M. Amigo. “Application of Near-Infrared (NIR) Spectroscopy and Chemometrics to Classify and Authentify Wine Vinegars from Different Protected Designation of Origin”
- J. Sun, A. McGlone, R. Kunnememeyer, N. Tomer, & M. Punter. “Which Optical Geometry is Best to Detect Vascular Browning in Apples?”
Eigenvector at Chimiométrie XVII in Namur
Feb 4, 2016
Last month I had the pleasure of attending Chimiométrie XVII. This installment ran from January 17-20 in the beautiful city of Namur, BELGIUM. The conference was largely in French but with many talks and posters in English. (My French is just good enough that I can get the gist of most of the French talks if the speakers put enough text on their slides!) There were many good talks and posters demonstrating a lot of chemometric activity in the French speaking world.
I was pleased to see evidence of EVRI software in many presentations and posters. I particularly enjoyed “An NIRS Prediction Engine for Discrimination of Animal Feed Ingredients” by Aitziber Miguel Oyarbide working with the folks at AUNIR. This presentation was done with Prezi which I find quite refreshing. I also enjoyed posters about standardization in milk analysis, determination of post mortem interval, evaluation of pesticide coating on cereal seeds, and sorting of archeological material. All of these researchers used PLS_Toolbox, MIA_Toolbox or Solo to good effect.
EVRI was also proud to sponsor the poster contest which was won by Juan Antonio Fernández Pierna et al. with “Chemometrics and Vibrational Spectroscopy for the Detection of Melamine Levels in Milk.” For his efforts Juan received licenses for PLS_Toolbox and MIA_Toolbox. Congratulations! We wish him continued success in his chemometric endeavors!
Finally I’d like to thank the organizing committee, headed by Pierre Dardenne of Le Centre wallon de Recherches agronomiques. The scientific content was excellent and, oh my, the food was fantastic! I’m already looking forward to the next one!
BMW
30 Years of Chemometrics
Sep 30, 2015
On October 1, 1985 I walked into Bruce Kowalski’s chemometrics class and my world changed forever. It was my first day of chemical engineering graduate school at the University of Washington. My M.S. thesis advisor, Prof. Harold Hager, told me that I’d probably find the methods in Bruce’s class useful in treating the data I was to collect. He was right, but more than that, it wasn’t long before I knew that I’d found something I wanted to do for a living.
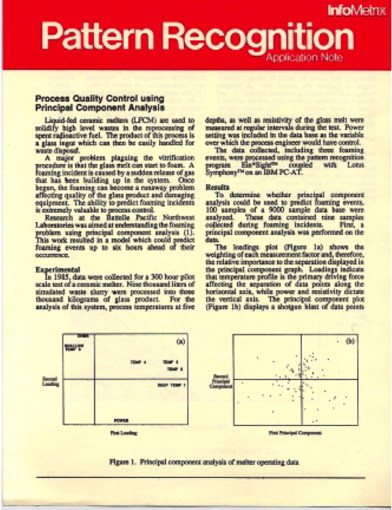
A big part of the class was a project, due at the end of the semester in early December. I spent my Thanksgiving vacation working with Infometrix’s Ein*Sight software doing PCA on data from a Liquid-Fed Ceramic Melter I’d worked on at Pacific Northwest National Laboratory. Ein*Sight had a limit of 100 samples and 10 variables but it ran on an IBM AT. I spent a lot of time swapping interesting samples in and out of the analysis and trying to interpret the results. I got an A on the project (Bruce gave lots of A’s!) and my study became a piece of Infometrix sales literature (left). From there I started working with Prof. Larry Ricker on my ChemE Ph.D. with Bruce on my committee. The rest, as they say, is history.
I always liked data analysis. As an undergrad in ChemE my lab partners referred to me as the “Data Magician.” I just liked massaging the numbers to see what I could tease out. Chemometrics gave me a whole new set of tools and opened my world up to high dimension data.
Chemometrics has taken me lots of interesting places over the last 30 years, and I mean that both with regards to the travel and the intellectual challenges. And I’ve been blessed to meet lots of great people. It’s awesome to go to a conference in a faraway place and walk into a room full of friends.
Thanks to all my friends and colleagues for a great 30 year adventure! But, man!, that was fast! Where did the time go? But I’m looking forward to a couple more decades of chemometrics escapades.
BMW
EigenU 2015 Poster Contest Winners
May 23, 2015
Like its predecessors, the 10th Annual Eigenvector University included the Tuesday evening PLS_Toolbox/Solo User poster session. Eight posters, which spanned a wide range of applications, were scrutinized by about 40 attendees. A good time was had by presenters and viewers alike as we enjoyed hors d’oeuvres, beverages and scientific discussion.
Amanda Lines of Pacific Northwest National Laboratory (PNNL) captured this year’s top prize with “Remote Raman technology for in-situ identification of nuclear tank waste.” The poster revealed how Raman spectroscopy combined with multivariate calibration can be used to analyze surfaces at distances up to 50 feet. Ms. Lines is shown below with her poster and EVRI Vice-President Neal B. Gallagher.

In a very close contest the runner up Anna Klimkiewicz of the University of Copenhagen presented “A chemometric approach to the optimization of bio-industrial processes.” The work illustrated the application of multivariate analysis to understand and improve performance in an industrial-scale continuous enzyme purification process. Ms. Klimkiewicz can be seen with her poster (and me) below.

Both of these posters clearly presented an interesting story and made especially good use of our PLS_Toolbox. As a reward for their efforts Amanda took home a pair of Bose Noise Canceling Headphones while Anna took home a Bose Bluetooth Speaker system. Well deserved! 👍 We hope you enjoy them.
Thanks to everybody who attended and presented at EigenU!
BMW
Chemometrics Consultant position opening at Eigenvector Research
Feb 25, 2015
Eigenvector Research, Inc. (EVRI) has an opening for a full time Chemometrics Consultant staff member. Applicants should have a M.S. or Ph.D. degree in Chemistry, Chemical Engineering, or a closely related field and at least five years experience developing chemometric models. Experience in the pharmaceutical, chemical, medical device, food and beverage or bioinformatics fields would be useful. Practical knowledge of analytical techniques, especially spectroscopy, required. Must be proficient in MATLAB. Experience with Javascript, HTML, CSS and other programming languages would be a plus. Experience with EVRI’s software, especially PLS_Toolbox and MIA_Toolbox, sought. Experience with other chemometrics packages also a plus. Teaching experience desired.
The successful candidate is expected to take a lead role on some chemometrics consulting projects and a supporting role on others. Must be able to meet with potential clients, understand their goals and needs, develop a statement of work, and execute the tasks. Good written and oral communications skills, especially the ability to convey complex information to non-experts, required. Potential to attract new projects through new and existing contacts preferred. Must be able to work at home. Location not critical but proximity to our existing locations would be a plus.
EVRI employees enjoy working on interesting projects with a dedicated, fun and lively team of chemometrics and programming experts. EVRI offers a competitive salary and benefits package, plus flexible hours and the ability to work at home.
Applicants should send a C.V. and letter of interest to Barry M. Wise.
Nonlinear Model Support Added to Model_Exporter
Oct 22, 2014
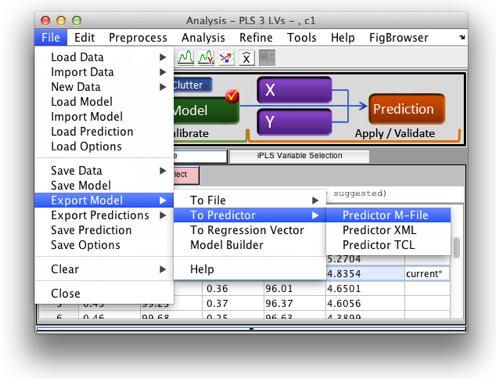
Model_Exporter is EVRI’s software for turning multivariate/chemometric models into formats which can be compiled into online applications. It offers an alternative to our stand-alone prediction engine Solo_Predictor. Model_Exporter allows users of our MATLAB® based PLS_Toolbox and stand-alone Solo to easily create a numerical recipes of their models. These recipes give the step by step procedure that take a measurement and calculate the desired outputs, such as concentration, class assignment, prediction diagnostics, etc. This includes applying all preprocessing steps along with the model (PCA, PLS, PLS-DA etc.) itself. When Model_Exporter is installed, models can be exported into predictor files in a variety of formats via the file menu in the Analysis window as shown below.
Model_Exporter also includes two versions of the freely-distributable Model_Interpreter. Either the C# or Java version of the Model_Interpreter can be used by any 3rd party program to add the ability to parse an exported model in XML format. Simply point the interpreter at an XML exported model and supply the data from which to make a prediction. The interpreter applies the model and returns the results. Model_Interpreter has no licensing fees and is appropriate for use on standard processors and operating systems or on handheld devices run by reduced instruction set processors (e.g. ARM). Your application doesn’t need to know anything about the preprocessing or model being used.
Version 3.0 of Model_Exporter was released in early October along with its associated stand-alone Solo+Model_Exporter version 7.9. This release includes support for Support Vector Machine (SVM) regression and classification models as well as Artificial Neural Network (ANN) regression models.
These changes represent a significant addition to Model_Exporter making it even more unique in the chemometrics world. No other chemometric modeling product offers anything as transparent, flexible or unencumbered by licensing. You can get more info about Model_Exporter by consulting the Release Notes and the Model_Exporter Wiki page.
Users with current maintenance can access these versions now from their account. If expired, maintenance can be renewed through the “Purchase” tab.
If you have any questions, feel free to write us at orders@eigenvector.com.
BMW
Classical Least Squares (CLS) with Nonlinear Spectra
Oct 20, 2014
In the last several years we’ve seen a resurgence of interest in Classical Least Squares (CLS) modeling. To address that our Neal Gallagher is developing a course on CLS Methods for the next EigenU. Our interest also stems from the fact that we’ve worked on a number of consulting projects where CLS models are appropriate for calibrating spectroscopic systems. As you might expect, these systems are relatively simple mixtures in gas or liquid phase. Recall the CLS model is
X = CS‘ + E
where X is the measured spectra, C is the matrix of concentrations, S is the pure component spectra and E is noise.
Complicating matters a bit, several of the systems we’ve worked with exhibit significant nonlinearities due to high absorbance features. In spite of that, CLS models can work quite well if set up correctly. What follows is an example that demonstrates this (which I originally did just to clarify how this works in my own mind).
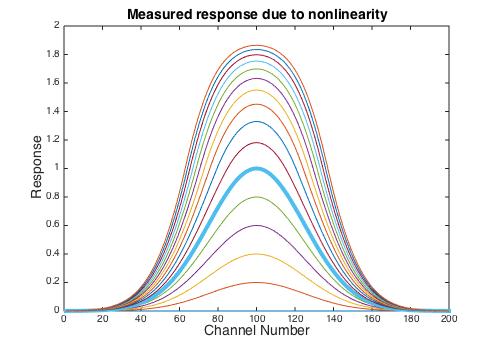
Suppose you have a single component system with a pure component response that is a simple Gaussian peak centered in the spectral range with a maximum value of one when the concentration is also one. Furthermore, suppose that the spectra is linear up to an absorbance of one but rolls off after that. (For xideal > 1 I used xmeasured = 2-exp(-(xideal-1)) but the exact form of the nonlinearity isn’t critical.) The measured spectra for concentrations from 0 to 3 is shown below, with concentration = 1 shown as the thick blue line. It is apparent that the shape changes as the concentration exceeds 1.
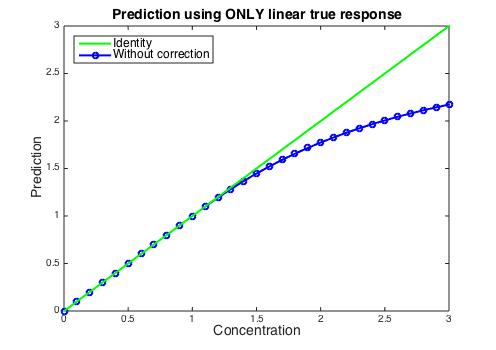
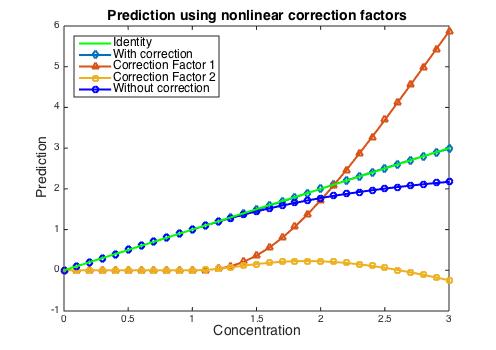
If the concentration is estimated using the ideal (concentration < 1) response, the estimate will fall below the actual value as the concentration passes 1, as shown below. If the spectral residuals were observed it would be apparent that there was a problem, but how to fix it?
If the ideal response for each concentration is estimated, then the difference between it and the observed response can be calculated, as shown in the top panel in the figure below. Because each difference spectra has a slightly different shape, the rank of this difference matrix is equal to the number of samples exhibiting non-linear behavior, which in this case is 20 (the samples with concentration 1.1 to 3). However, it is easy to get a basis for the nonlinear deviations using the Singular Value Decomposition (SVD). Furthermore, the singular values indicate that 93.7% of the residual sum of squares is captured in the first factor, and 98.6% is captured in the first two. The ideal response along with the first two basis vectors is shown lower panel.
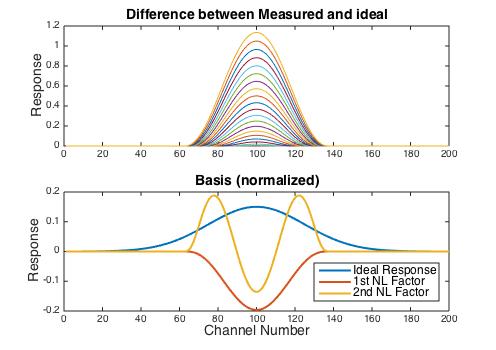
When the CLS model is augmented with the two basis vectors, the prediction improves dramatically. The figure below shows the predicted concentration of the analyte as well as the “concentration” of the two additional basis vector factors. The correction added by the 1st nonlinear factor becomes quite large at high concentrations, whereas the contribution of the 2nd nonlinear factor remains relatively small. The prediction error in the concentration of the analyte is less than 1%.
In a future blog post we’ll explore some other aspects of CLS models.
BMW
MATLAB R2014b and PLS_Toolbox 7.9
Oct 7, 2014
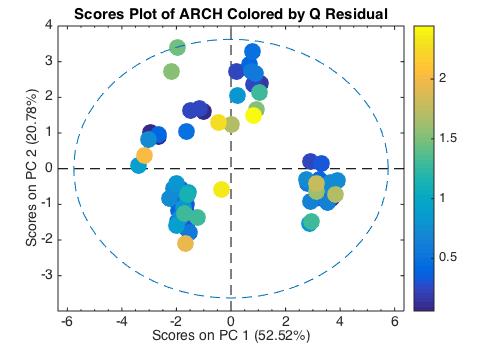
The MathWorks released MATLAB R2014b (version 8.4) last week, and right on its heels we released PLS_Toolbox 7.9. R2014b has a number of improvements that MATLAB and PLS_Toolbox users will appreciate, specifically with graphics. The new MATLAB is more aesthetically pleasing to the eye, easier for the Color Vision Deficiency (CVD) challenged, and smoother due to better anti-aliasing. An example is shown below where the new CVD-friendly Parula color map is used to indicated the Q-residual values of the samples.
But the most significant changes in R2014b are really for people (like us) that program in MATLAB. For instance, TMW didn’t just change the look of the graphics, they actually changed the entire handle graphics system to be object oriented. They also added routines useful in big data applications, and improved their handling of date and time data. When you start the new MATLAB the command window greets you with this:
“Some existing code may need to be revised to work in this version of MATLAB.” That is something of an understatement. In fact, R2014b required the update of almost every interface from PLS_Toolbox 7.8. Revising our code to work with R2014b required hundreds of hours. But the good news for our users is that we were ready with PLS_Toolbox 7.9 when R2014b was released AND, as always, we made our code work with previous versions of MATLAB (back to R2008a). This, of course, is the significant difference between a supported commercial product and freeware. Not only do you get new features regularly, but you can rely on it being supported as operating systems and platforms change.
So if you look at the Version 7.9 Release Notes, you won’t see a lot of major changes. Instead, we took the time to assure compatibility with R2014b and made many minor changes to improve usability and stability.
The new MATLAB will allow our command-line and scripting users to do their science more efficiently and present their result more elegantly. These improvements will benefit us as well, and will ultimately translate into continued improvement in PLS_Toolbox and Solo.
BMW
Chemometrics Training and QbD
Jun 13, 2013
Emil W. Ciurczak wrote a nice blog post for PharmaEvolution claiming that the weak link in QbD is a lack of adequately trained chemometricians. I enjoyed his article, Chemometrics: The Weak Link in QbD, and I agree wholeheartedly with the conclusion that “the need for correct and in-depth chemometrics training is necessary for a successful PAT program.” But I don’t see how this is reconciled with “The title and spirit of this brief educational brochure from one vendor are right on target.” Anything that is “For Dummies” almost surely cannot be “in-depth.” And while I applaud the vendor for coming up with the concept, (and I’d say I wish we’d thought of it except we did think of it and the result is our CWE-Chemometrics without Equations courses) there isn’t much real information in the brochure. For instance Chapter 4 on classification is just 3 pages, one of which is just a list of applications.
The fact that chemometrics remains the weak link iin QbD is disappointing but it certainly isn’t for lack of effort on our part. We’ve taught hundreds of classes and thousands of students but a fairly small fraction of those are from pharma. From our business point-of-view, but also as a consumer of pharma products, I’d be happy to see more effort go into developing staff with chemometrics expertise. I do appreciate that it is, for many people, rather challenging subject material. We have put great effort into making chemometrics accessible. But I resist the urge to dumb it down too much.
An often used analogy is that most people don’t know how their mobile phone works but they are still able to use it, and chemometrics should be just as easy. But, unlike cell phones, chemometric tools aren’t being used by consumers, they are part of the process for producing things like mobile phones. And drugs. As such, their use and misuse has consequences. And while I’m happy to introduce people to chemometrics with our CWE courses and think attendees gain a useful level of proficiency and understanding of the techniques involved, I would prefer that those involved in QbD and pharma manufacturing acquire a deeper level of mastery. (To this end we provide our Eigenvector University courses, the next instance of which is EigenU Europe this October.) In order to understand a system’s limitations and how it can fail, you really need to understand how it works. You’re not going to get that at the “Dummies” level.
I very much appreciate Emil’s continued efforts to enlighten pharma as to the critical role of chemometrics. But, like me, does he sometimes feel as though he is pushing a string? I was struck by the registration process for PharmaEvolution website when you had to select your company’s business. There was a very long list of possibilities, but the closest thing to what we do was the very generic selection “engineering.” I still get the feeling that many in pharma (and certainly in some other industries) think of chemometrics as something that you do AFTER you’ve decided everything else and have started to take data. Thank-you, Emil, for your efforts to make it the integral part of the system that it must become.
BMW
EigenU Poster Session: Apple iPad mini and iPod nano ordered
Apr 29, 2013
Each year at Eigenvector University we host a PLS_Toolbox/Solo User Poster Session and User Group Meeting. This is a fun event as it gives our users a chance to show what they have been doing with our tools. It is also a chance for them to relax, have a beverage, and give us input on upcoming versions of our software.
This year’s EigenU Poster Session will be Tuesday, May 14, at 6:00 at the Washington Athletic Club. PLS_Toolbox and Solo users will showcase their own chemometric achievements and share results and remaining problems with other users and the EigenU instructors. We’ll also have a brief User Group Meeting where attendees can see what’s in the future of Eigenvector software development and give their input and feature requests.
The poster session and user group meeting will include complimentary beverages and hors d’oevres. This year’s Best Poster grand-prize is an Apple iPad mini (32GB). The runner up will receive an Apple iPod nano. Judging will be done by the EVRI staff. Attendance at the poster session is free and open to all EigenU attendees and Eigenvector software users. You need not attend classes at EigenU to come!
If you would like to present your work, please send a title and brief abstract to bmw@Eigenvector.com. Please be sure to describe how PLS_Toolbox, Solo or our other software products were used in the work.
See you there!
BMW
Chemometrics Q&A at FOSS Video
Jan 28, 2013
We have developed a collaboration with FOSS where we teach an open chemometrics course at their World Headquarters in Hillerød, Denmark, each fall. During our last course, the FOSS folks asked if I would do an interview for their NIRPerformance.com website. The website is a resource for Feed industry professionals who work with Near Infrared (NIR) spectroscopy.
The interview is a little bit slanted towards NIR users but contains some good general information about our courses, consulting and general chemometrics philosophy. In the video I answer the following questions about chemometrics and our courses:
- Whom are your chemometrics courses for?
- How much of an NIR solution is based on chemometrics?
- What does the average NIR user need to know about chemometrics?
- What are the trends in chemometrics today?
- How will your course attendees use their training in chemometrics?

Our next big training event is Eigenvector University 2013. This 8th Annual EigenU runs May 12-17 in Seattle. We have a number of other training opportunities in 2013, including courses in the UK, Spain and France. See our schedule for details. We also plan to be back at FOSS for EigenU Europe this October.
BMW
What’s Unique About Your PLS?
Jan 10, 2013
I got an email from a prospective user of our software the other day that really set me back. Paraphrasing a bit here, it was “Are there any unique features of your PLS algorithm/diagnostics?” The problem with questions like this one is that I never know where to start. But here is what I wrote.
As for “unique features of your pls algorithm,” well, there are numerous ways to calculate a PLS model, but they all pretty much arrive at the same result (which is good). If you’d like to learn more about PLS algorithms and their accuracy, I suggest you have a look at a series of blog posts I did on the subject. See:
Accuracy of PLS Algorithms
Re-orthogonalization of PLS Algorithms
One Last Time on Accuracy of PLS Algorithms
Speed of PLS Algorithms
As to diagnostics, most of the packages use pretty much the same diagnostics, though sometimes they call them by different names. Usually there is a sample distance metric (e.g. T2) and some sort of residual (e.g. Q).
But maybe what you are really looking for is what makes our software unique, rather than our specific PLS algorithm. We have two major packages for chemometrics. The first is our MATLAB-based PLS_Toolbox, the second is our stand-alone product Solo, which is essentially the compiled version of PLS_Toolbox. The two packages provide identical interfaces and share the same model and data formats. The advantage of PLS_Toolbox is that, because it works within the MATLAB environment, it can be run from the command line and functions from it can be incorporated into other analyses. The advantage of Solo is that you don’t have to have MATLAB.
So right off the bat, a unique feature of our software is that there are completely compatible solutions for working with or without MATLAB. And both of these solutions are available on all platforms, including Windows, Mac OSX and Linux. That is unique.
PLS_Toolbox and Solo have the widest available array of analysis methods. This includes PLS and PCA of course, but also PCR, MLR, MCR, PARAFAC, N-PLS, PLS-DA, SIMCA, SVM, KNN, CLS, LWR, MPCA, Cluster Analysis and Batch Maturity. Plus they have a large number of auxiliary tools for Instrument Standardization, Data Transformation, Dynamic Modeling, Sample Selection, Trend Analysis, Correlation Spectroscopy and Design of Experiments. And numerous tools for variable selection including Genetic Algortihm, iPLS and Stepwise MLR. Plus diagnostic methods such as VIP and Selectivity Ratio. The collection of all of these analysis methods and auxiliary functions with one interface is unique.
PLS_Toolbox and Solo can be extended for use with Multivariate Images with MIA_Toolbox and Solo+MIA. The ability to apply such a wide array of multivariate analysis techniques to images is unique. There is also an add-on for the patented Extended Multiplicative Scatter Correction, EMSC_Toolbox. If not completely unique, this method for preprocessing data from highly scattering samples is not widely available.
For on-line application there is our Solo_Predictor and Model_Exporter. Solo_Predictor can be used with any model generated by PLS_Toolbox/Solo and can communicate via TCP/IP sockets, ActiveX, .NET, timed action or wait-for-file. Model_Exporter translates PLS_Toolbox/Solo models into mathematical formulas that can be compiled into other languages. Model_Exporter’s XML output can be parsed for execution in .NET (C#). Additional output formats include MATLAB .m file (compatible with older versions of MATLAB and OCTAVE, plus LabView, Symbion and Tcl). This wide array of on-line options is unique.
Beyond that, PLS_Toolbox and Solo are also extremely flexible tools and include the widest array of data preprocessing methods with user-specified ordering, ability to add user-specified method, and customizable favorites settings.
And finally, price. PLS_Toolbox is only $1395 for industrial users, $395 for academic. Solo is $2195/$695. The price/performance ratio of these products is most certainly unique.
If you have any questions about the specific functionality of our software, please write me.
BMW
Bruce Kowalski
Dec 3, 2012
I was sitting in a cubicle in the United Club at Chicago O’Hare when I learned of Bruce Kowalski’s passing. The news was not unexpected, but it was still tough, in part due to my whereabouts in a busy place but with no friends or family. Additional memories factored in: I had also been in a United Club cubical when I heard of my father’s death. But this was especially ironic because Bruce was the reason I was there in the first place, on my way to Lille for ChemomeTRIcS in Time-Resolved and Imaging Spectroscopy.
I met Bruce on what turned out to be the most pivotal day of my life, October 1, 1985. My existence divides between everything that came before that day and everything that came after. It was my first day of graduate school, the day I started learning about chemometrics, and also the day I met my friend and business partner Neal Gallagher. Bruce introduced me to the discipline that I became immediately enamored with and have spent my working life on. Bruce also introduced me to his then Post-Doc Dave Veltkamp and his wife Diane who in turn introduced me to my wife, Jill. This accounts for pretty much everything else in my present life.
An “idea guy” who’s enthusiasm was infectious, Bruce’s achievements include co-founding, with Svante Wold, the field of chemometrics, and co-founding, with Jim Callis, the Center for Process Analytical Chemistry. The full breadth of Kowalski’s influence is really too big to capture in this small space and couldn’t be done without substantial research. But as an example of his influence in one area I submit a graphic prepared by Pieter Kroonenberg and presented at TRICAP 2000. The “Kowalski Web” demonstrates that, for the field of Multi-way Analyisis in Chemistry and as far as it has become connected to Multi-way Analysis in Psychology, all the connections lead to Bruce, the center of the web. If this graphic were updated today Bruce would still be at the center, but it would be much larger!

I could go on and on about Bruce’s influence. At least two software companies exist today because of him, Infometrix and Eigenvector. Chemometrics has enabled the development of countless sensor systems and greatly expanded applications of spectroscopy, especially NIR. The methodologies promoted by Bruce have become so pervasive that quantifying their impact would be a very large exercise.
Bruce taught me lots of things, both chemometricly and otherwise. The chemometric stuff is (I hope) obvious, so I’ll let that speak for itself. Beyond that, though, Bruce taught me to think big, that a good idea can’t be stopped, that it is important what you name things, to be magnanimous, and to spread the credit around. Bruce was always really good at talking up the people that worked for him. He found the best in people, let them know it, and then let other people know about it too. I’ve benefited greatly from that, as have many others. I hope that I’m as good with my staff as Bruce always was with his. And I strive to be as forward-looking, positive and fun to be around.
Farewell, Bruce. A little bit of you will live on in each of very many of us. You will remain in our thoughts and prayers.
BMW
Chemometrics without Equations Extended at EAS
Oct 17, 2012
The popular Chemometrics without Equations (CWE) series will be extended at the Eastern Analytical Symposium (EAS) this year with the addition of a second day, CWE II. While the original CWE focuses on the basics of Principal Components Analysis (PCA) and Partial Least Squares (PLS) regression, CWE II will explore advanced data preprocessing methods and mixture analysis.
I have been known to say that the secret to getting good regression models is what you do before the data hits the modeling algorithm. Preprocessing methods attempt to remove extraneous variance so that the variance of interest can be more easily modeled. When done correctly, preprocessing can greatly improve model performance. CWE II covers the whys and hows of data preprocessing with examples from several methods.
Also covered in CWE II, Mixture analysis techniques, such as Multivariate Curve Resolution (MCR) aka Self-Modeling Mixture Analysis (SMMA), can elucidate the true underlying physical roots of the data, e.g. pure component spectra and chemical concentrations. As such, these methods can lead to better fundamental understanding of the systems involved.
The courses will be led by Dr. Don Dahlberg, Emeritus Professor at Lebanon Valley College. Don will be assisted by EVRI’s Chief of Technology Development Dr. Jeremy M. Shaver.
The courses will be held Sunday and Monday, November 11 and 12, at the Holiday Inn in Somerset, NJ. Registration is handled by EAS. Complete course information can be found in EAS’s Short Course Schedule and Description.
BMW
Off to SCIX 2012 in Kansas City
Sep 25, 2012
EVRI will have a strong presence at SCIX 2012 (formerly FACSS) next week, September 30 to October 5. Eigenvectorians Jeremy Shaver, Bob Roginski and Randy Bishop will be busy teaching, speaking and representing Eigenvector.
EVRI is offering two hands-on short courses at SCIX: Chemometrics without Equations (CWE) and the follow-on Advanced Chemometrics without Equations (ACWE). CWE will be presented as a two-day course, September 30-October 1 (Sunday-Monday), while ACWE is one day, October 3 (Wednesday). Jeremy, Bob and Randy will be tag-teaming as instructors, so participants will get a chance to interact with all three of them. They each have abundant experience in the field of chemometrics, but somewhat different perspectives, so it should make for lively courses. Registration can be done on-site.
As usual, EVRI will be involved with the Technical Sessions. At 2:20 Monday afternoon Jeremy will present “Data Sampling for Extending the Life of NIR-based Models” in Chicago C. This talk deals with the problem of updating models using historical (non-designed) data. Methods for selecting data subsets are compared relative to the goal of improving the model while minimizing costs. Bob will present the poster “Target Detection Applied to Detection of Adulterants in Powdered Raw Material using Near Infrared Hyperspectral Imaging” at the Wednesday morning poster session in the Exhibit Hall. An application of detecting melamine in wheat gluten is shown.
The Exhibit opens Monday evening with a reception from 5:30 to 7:30. This is always a fun event, so be sure to stop by Booth 47 for your complimentary Eigenvector Bottle Opener. The Exhibit is also open Tuesday 9:00-4:30 and Wednesday 9:00-4:00. The Eigenguys will be demoing the upcoming PLS_Toolbox and Solo version 7, to be released this fall.
Jeremy will also represent Eigenvector on the panel of the Student Free Lunch and Employment Discussion on Tuesday.
It will be a busy week. Have fun, Jeremy, Bob and Randy!
BMW
Chemometrics Software for Classroom Use
Sep 17, 2012
Autumn is nearly here and with it comes the first semester of the school year. This morning I was greeted by a sign of fall: a slew of student account creation notifications, drifting into my email inbox like falling leaves.
At EVRI, we work with professors to make our software freely available to students enrolled in chemometrics courses. Students can get free 6-month demo licenses of our MATLAB-based PLS_Toolbox and MIA_Toolbox, or stand-alone Solo or Solo+MIA.
I traded emails this morning with Professor Anna de Juan of the Universitat de Barcelona. This will be the third year we’ve worked with Prof. de Juan on her chemometrics class. She wrote, “we had a very good experience the two semesters using PLS_Toolbox in the classroom. The students were happy and only a pair of them had problems of installation at home. It really made it easy that they could play with proposed data sets out of the classroom, at their own pace and exploring many possibilities.” de Juan noted her students typically use Solo at home because they generally don’t have personal copies of MATLAB.
Another advantage of Solo is that it is available for multiple platforms, including Windows, Linux and Mac OS X. I see lots of Apple laptops on college campuses. A search of the web reveals estimates ranging from 30-70% of college students using Macs. We see a substantial number of student downloads of our Solo for Mac, and expect that number to grow.
Interested in teaching Chemometrics? Drop me a line and we’ll be happy to work with you to provide software for your students.
BMW
By Popular Demand: EigenU Online
Jun 22, 2012
At the last several editions of Eigenvector University (aka EigenU) our beginning track courses have been consistently overbooked. This includes the first three days of courses consisting of Linear Algebra for Chemometricians, MATLAB for Chemometricians, Chemometrics I: PCA, and Chemometrics II: Regression and PLS. There were also EigenU attendees with schedule conflicts that made it impossible for them to attend some of these courses, but they needed the background to attend other EigenU courses.
Therefore, due to popular demand, we’ve created EigenU Online. EigenU Online allows users to get chemometrics training on their own schedule and at their own desk. The material covered is the same as in their EigenU counterparts. Courses consist of video lectures using both slides and software demonstrations, plus course notes in .pdf format. Additional materials and data sets are included for some courses.
The goal of the EigenU Online courses is to provide students the background they’ll need to understand the chemometric methods presented and accomplish typical modeling tasks in PLS_Toolbox and Solo. But, like our EigenU courses, they aren’t just about using software! No matter whose software you use, you’ll be a better user after EigenU Online.
We’ve made a couple segments of our online courses available free for your evaluation. Just login to your Eigenvector account, or create one. Under the EigenU Online tab you’ll see a link to the lecture Classical Least Squares – Introduction, and to Classical Least Squares – Hands-on Example which shows how the course software demonstrations work.
For complete information, see the EigenU Online page. Still have questions? Write to me at bmw@eigenvector.com.
BMW
EigenU 2012 Poster Session Winners
May 21, 2012
EigenU 2012, the Seventh Annual Eigenvector University, was held last week at the Washington Athletic Club in Seattle. Our Tuesday evening PLS_Toolbox/Solo User poster session gave EigenU attendees a chance to unwind with hors d’oeuvres and beverages and discuss some chemometric applications. This year’s posters were judged by Paul Geladi, professor of Chemometrics at SLU, the Swedish University of Agricultural Sciences.
Bob Moision of Aerospace Corp. claimed first prize with “Application of MCR to VIIRS On-Orbit Anomaly Investigation.” Bob’s poster described how multivariate analysis was used with ToF-SIMS data in an investigation into the cause of the unexpected poor sensitivity of the Visible/Infrared Imager Radiometer Suite (VIIRS) on the Suomi National Polar-orbiting Partnership satellite. Bob is show below accepting his Apple iPod nano.

Second prize was awarded to Gordon Allison of Aberystwyth University for “Diagnosis of TSE disease in cattle and sheep using metabolomic analysis and computer learning technologies- GC/MS approaches.” The poster summarized results of a project aimed to identify novel, non-prion markers of transmissible spongiform encephalopathy (TSE) disease in samples of blood plasma from infected cattle and sheep that consistently indicate infection and which could be used for disease diagnosis in living animals before the appearance of clinical symptoms. Gordon is shown below accepting his nano from Eigenvector Vice-President Neal Gallagher.

This year’s poster session included a father-daughter project: Clare Wise presented “Analysis of Historical Stehekin River Flow Data with Principal Components Analysis and Multivariate Curve Resolution.” The poster described how PCA and MCR can be used on the daily Stehekin River flow data to model spring runoff and to find interesting years since measurements were started in 1927. Clare, who will be a freshman in Chemical and Biological Engineering at the University of Colorado next fall, is shown with her poster, and me, below.
 at EigenU")
Thanks to everyone who presented and attended this year’s poster session!
BMW
New Releases: PLS_Toolbox and Solo 6.7, MIA_Toolbox 2.7
Mar 20, 2012
Updates to our flagship PLS_Toolbox and Solo were released last week; they are now in version 6.7. This is in keeping with our policy, (began in 2008), to release significant upgrades twice yearly. Our Multivariate Image Analysis (MIA) tools were also updated with the release of Solo+MIA 6.7 and MIA_Toolbox 2.7.
As the Version 6.7 Release Notes show, the number of additions, improvements and refinements is (once again!) rather long. My favorite new features are the Drag and Drop import of data files, Confusion Table including cross-validation results for classification problems, and Custom Color-By values for plotting.
PLS_Toolbox/Solo can import a wide variety of file types, and the list continues to grow. Drag and Drop importing allows users to drag their data files directly to the Browse or Analysis windows. They will be loaded and ready for analysis. For instance, users can drag a number of .spc files directly into Analysis. Forget some files or have additional files in a different directory? Just drag them in and they will be augmented onto the existing data.
The Confusion Table feature creates several tables summarizing the classification performance of models. This includes a “confusion matrix” giving fractions of true positive, false positive, true negative, and false negative samples and a confusion table which gives number of samples the actual and predicted classes. Tables are calculated for both the full fitted model and for the cross-validation results. The tables can be easily copy and pasted, saved to file, or can be included in the Report Writer output as html, MS Word or PowerPoint files.
With Custom Color-By users can color points in scores and loadings plots using any currently loaded data or with new data loaded from the workspace. For instance, samples in a PLS LV-2 versus LV-1 scores plot can be colored by the scores on another LV, their actual or predicted y values, leverage, Q residual, specific X-variable, additional Y-variable, or any custom variable from the work space. The allows deeper investigation into the cause of specific variations seen in the data.
Want to find out more about our latest releases? Create an account in our system and you’ll be able to download free 30-day demos. Want prices? No need to sit through a webinar! Just check our price list page, which includes all our products. Just click Academic or Industrial.
As always, users with current Maintenance Agreements can download the new versions from their accounts.
Questions? I’d be happy to answer them or refer you to our development team. Just email me!
BMW
Cross-validation Explained
Feb 27, 2012
I was recently teaching a chemometrics course with Rasmus Bro when he was asked to explain cross-validation. Rasmus sketched up an example to explain it, and I was inspired by that to turn it into a more formal movie. Just click on the link below to view it. Enjoy!
BMW