 SEARCH
Hyperspectral Image Analysis Tools
May 30, 2019
When I was first introduced to image analysis by Paul Geladi he referred to it as Multivariate Image Analysis or MIA. So when we released our image analysis package back in 2005 we called it MIA_Toolbox. Since then more and more analytical techniques have been adapted to produce images. On the micro scale this includes surface analysis techniques such as SIMS and Raman microscopy. On the macro scale it includes remote sensing such as infrared imaging. Based on the expansion of the number of channels in the spectroscopic dimension it’s become more common to refer to the data as Hyperspectral images. Regardless of what you call it, MIA_Toolbox was built to handle it!
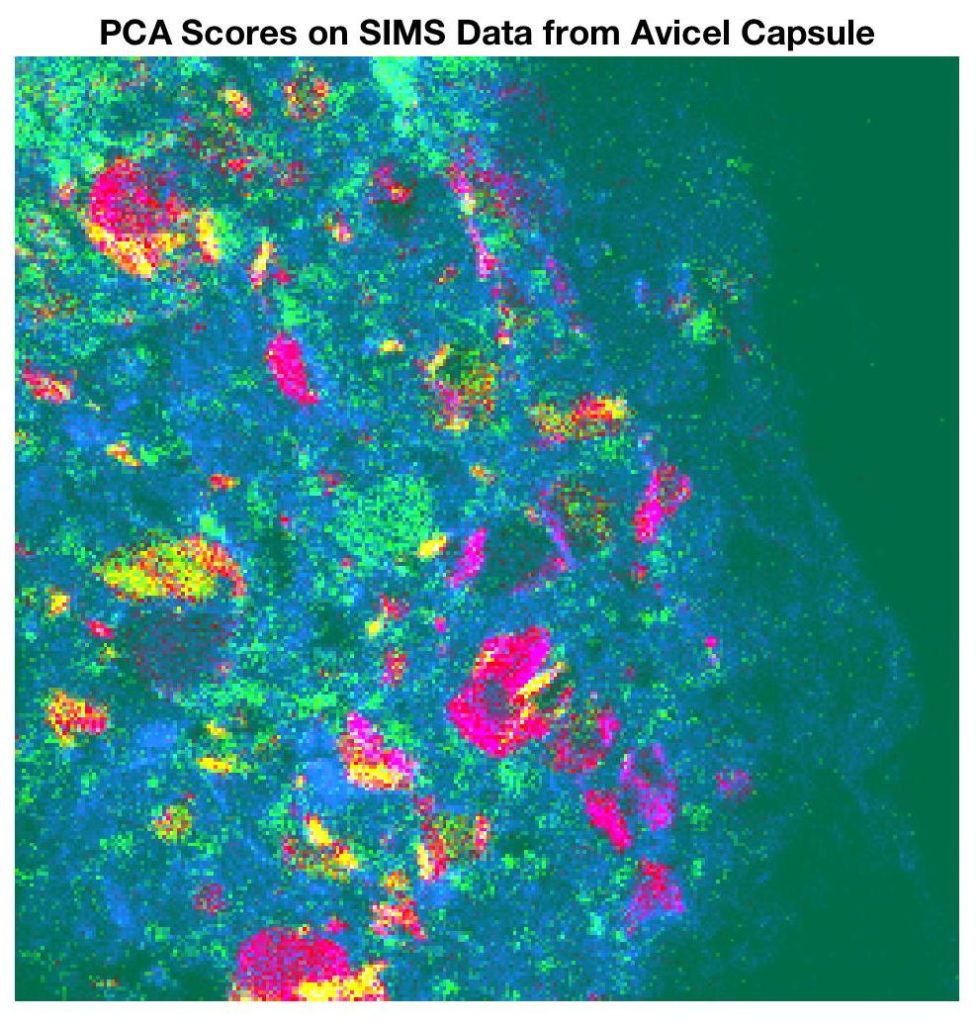
Early versions of MIA_Toolbox brought the conventional chemometric tools and preprocessing methods found in PLS_Toolbox to images, focusing the analysis more on the relationship between variables (typically wavelengths or mass) then on the relationship between pixels. In this it was a departure from conventional image analysis which focuses on the latter. For instance Principal Components Analysis (PCA) could be applied to images, where the neighboring pixels are treated independently, and then the results could be displayed back in the image plane as image score plots, such as the one below.
Of course many other methods could be applied in a similar fashion, including Multivariate Curve Resolution (MCR) and of course classification methods such as SIMCA and PLS-DA. It was also easy to do regression provided that reference values corresponding to the image were available.
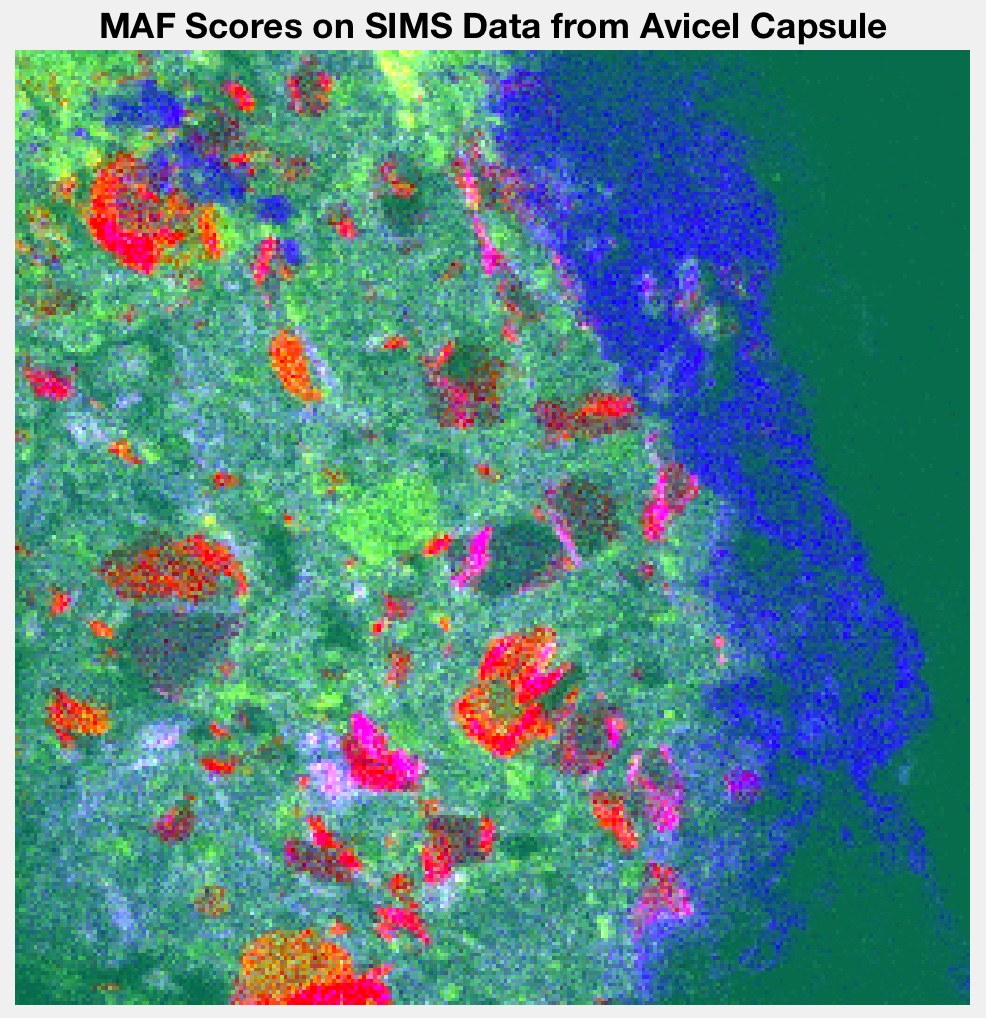
Since then we’ve added techniques that add spacial information such as Maximal Autocorrelation Factors (MAF) which finds factors that are more highly correlated in the image plane. An example of MAF is show below and it can be seen that it creates images with more contiguous areas than the PCA image shown above.
Texture is a measure of the spacial variations of intensity in an image. This property can be important in the quality of some manufactured surfaces, in crystallization processes, or to assess the homogeneity of pharmaceutical tablets. Since 2009 MIA_Toolbox has included texture filters which can be used to create spectra from images that capture the spatial variation.
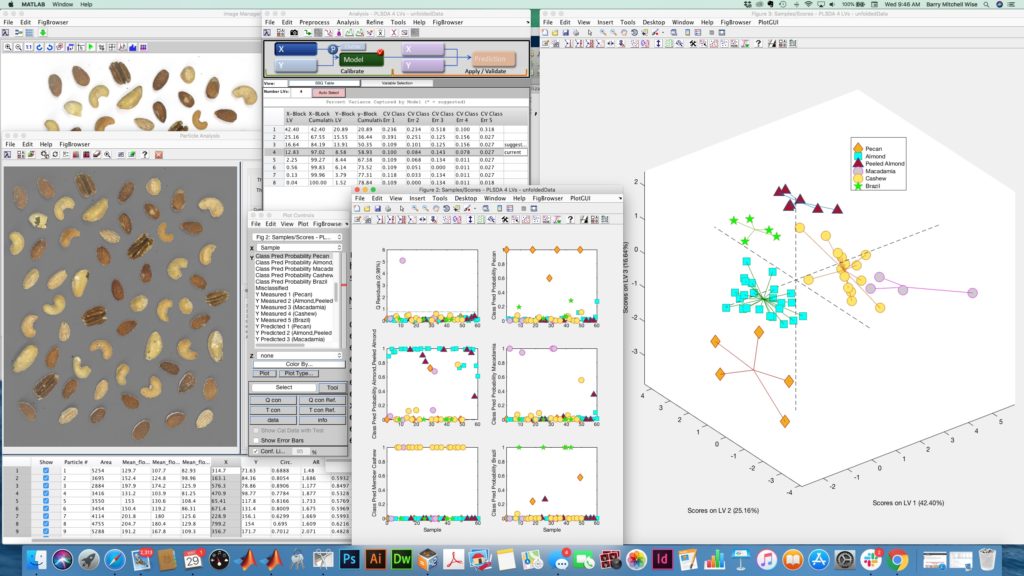
With the integration of the ImageJ image processing library into MIA_Toolbox in 2011 particle analysis was enabled. It is now possible to create a workflow where hyperspectral images of particles are treated with PCA to reduce dimensionality, then fed into particle analysis where each particle becomes a sample with measured size and shape characteristics, then those are pushed into a classification method to sort particles based on both their physical and chemical attributes. A screen shot from such a work flow is shown below.
In more recent releases we’ve continued to refine the useability of the tools, adding more file importers, preprocessing methods, etc. And of course all of this is also included in our stand-alone image processing package, Solo+MIA.
Want to learn more about image analysis? We’re doing courses at this year’s EigenU Europe in Montpellier, FRANCE, and the SCIX conference in Palm Springs, USA. At EVRI we’re excited to create tools that address the next generation of chemical analysis.
BMW