 SEARCH
Overfit < 1??
Feb 25, 2025
I’ve learned a number of things using Diviner, our new semi-automated Machine Learning tool for creating regression models. When you make models in large numbers on each data set you are presented, you begin to see some trends. For me, one of these was the discovery of how some data preprocessing methods work well surprisingly often. (I’m still flabbergasted that SNV followed by autoscaling works well for many spectroscopic data sets.) Another thing that happens is that you begin to see “anomalies” much more often when you make models by the hundreds.
The anomaly of interest here is the occasion when the error of calibration (root-mean-square error of calibration, or RMSEC) exceeds the error of cross-validation (root-mean-square error of cross-validation, or RMSECV). This is generally not expected as what this is saying is rather counter-intuitive: a model’s ability to predict data when it is left out is better than its fit to the data in the model. (!) Cross-validation curves for a Partial Least Squares (PLS) model generally looks like Figure 1 below.
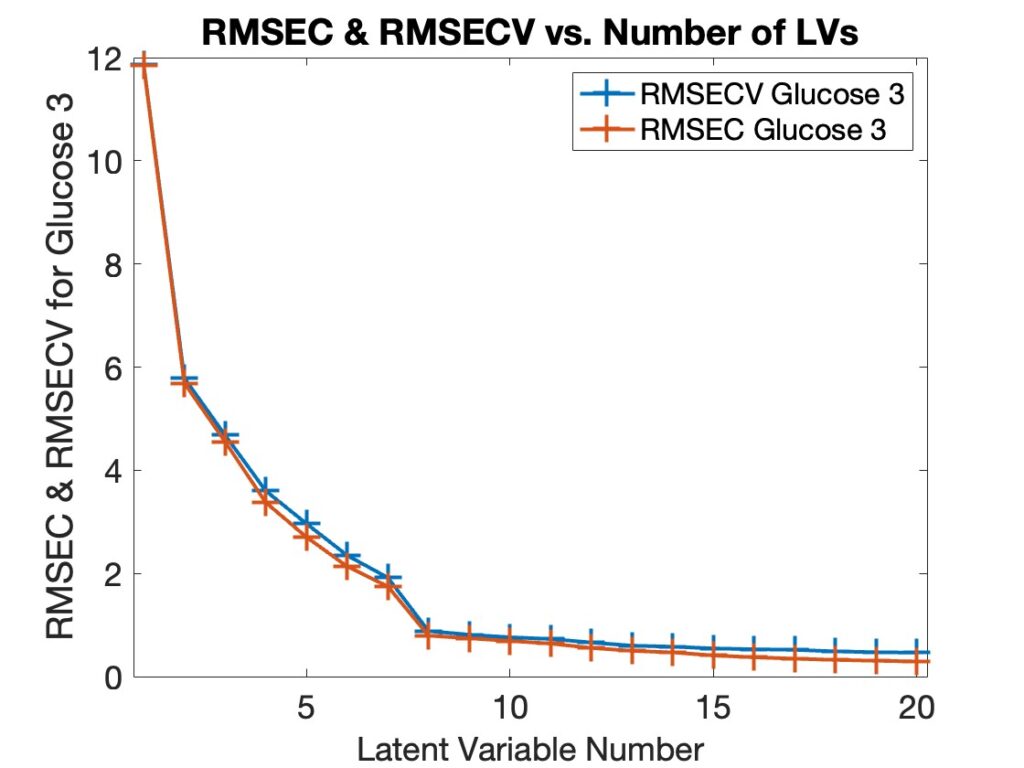
Figure 1: Typical Calibration Error (RMSEC) and Cross-validation Error (RMSECV) Curves for a PLS Model for Glucose from NIR Spectroscopy.
If you look closely in Figure 1 you’ll see that the RMSECV line (blue) is above the RMSEC line (red) in all cases. This is perhaps more obvious if you plot the ratio of RMSECV to RMSEC, as shown in Figure 2. In all instances this ratio is greater than 1. We refer to this as the “Overfit Ratio,” and it has become one of our favorite diagnostics for selecting model complexity. Ideally, a model’s fit error on the calibration data should not be much lower than its prediction error on the same data. If it is then the model is fitting the data much better than its ability to predict it which suggests it is fitting the noise in the data and is, therefore, overfit. It is typical for the overfit ratio to increase as the model complexity increases.
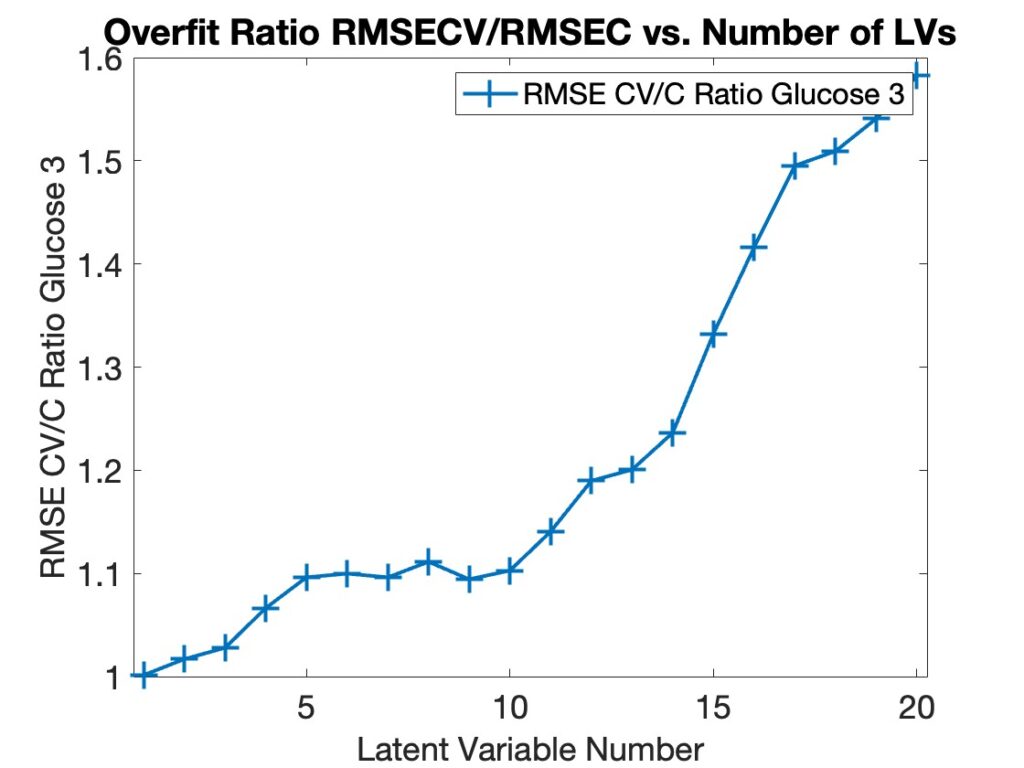
Figure 2. Overfit Ratio RMSECV/RMSEC for Model in Figure 1.
But every once in a while we get cross-validation curves that look like Figure 3, where the ratio RMSECV/RMSEC is great than 1 except at 6 PLS components. Note that this is for a 5-fold cross-validation split of the Casein/Glucose/Lactate (CGL) NIR data (compliments of Tormod Næs), where we are making a model for Casein and have pre-processed the data with a second derivative (21 point window, 2nd order polynomial).
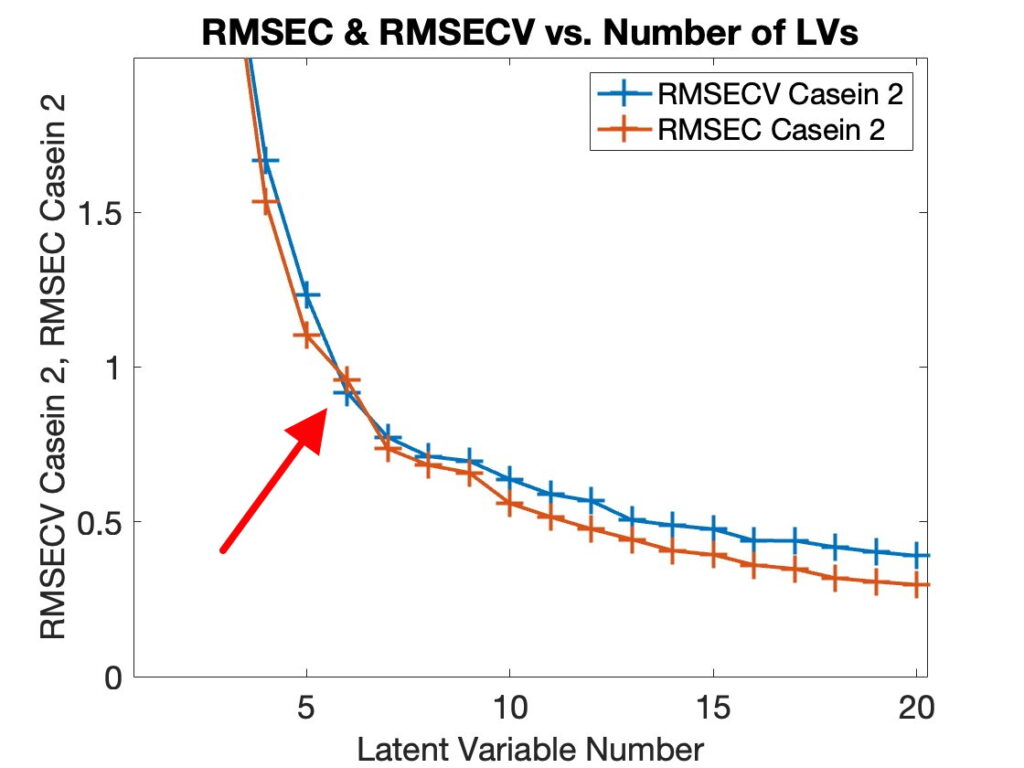
Figure 3. Calibration and Cross-Validation Error Curves for Casein (5-fold, 2nd derivative, 21-pt window).
When presented this way the anomaly is easy to ignore. In Diviner, however, we like to plot the model overfit RMSECV/RMSEC ratio versus the predictive ability, RMSECV. The idea being that the best models are the ones that have good predictive ability without being overfit, i.e. the models in the lower left corner. But when RMSECV < RMSEC, then RMSECV/RMSEC < 1, and these points stick out like a sore thumb on the plots, as shown in Figure 4, lower left corner. This is rather hard to ignore.
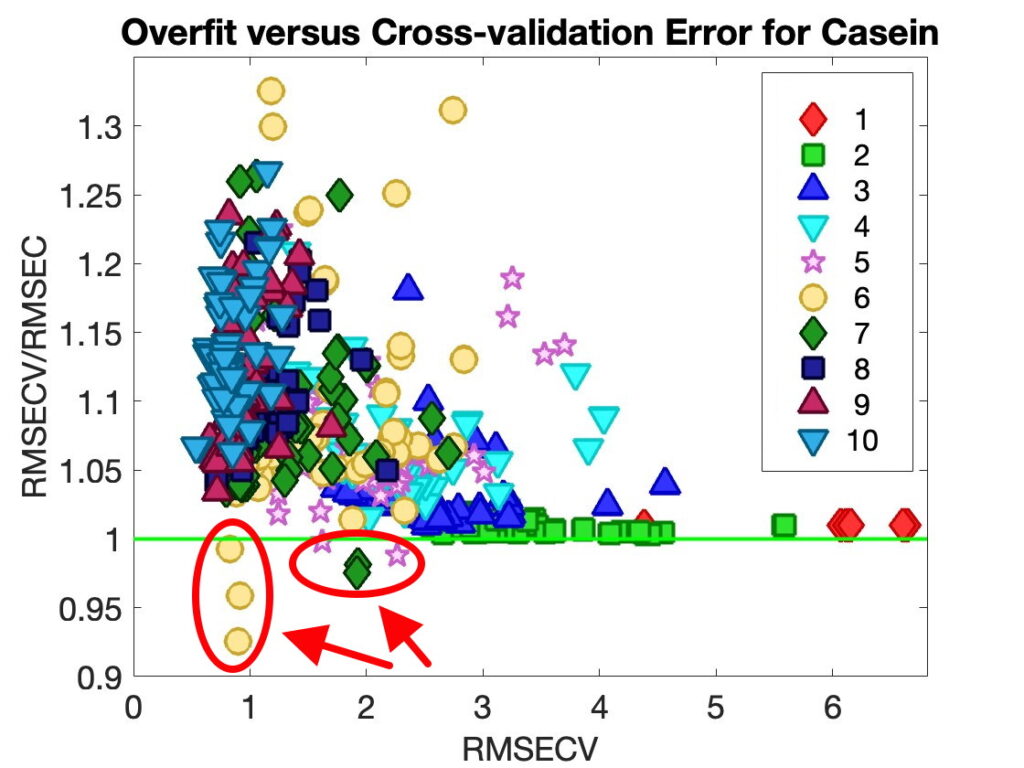
Figure 4. Overfit Ratio RMSECV/RMSEC versus Predictive Ability RMSECV for 80 Models with Different Combinations of Preprocessing and Variable Selection from Diviner. Number of PLS Latent Variables Shown.
My first question when I saw this phenomena was, “is it reproducible, or is it some quirk in the software?” The answer to that is that it is definitely reproducible. I should note here that we are doing conventional/full cross validation: the entire model is rebuilt from scratch using the full data set minus each left out split, no shortcuts, such as not recalculating the model mean, or cross-validating only the current factor, are used.
The next question is “what conditions lead to this phenomena?” On that I’m substantially less certain. First it seems likely that this is NOT possible when using Leave-one-out (LOO) cross-validation. When leaving only one sample out of a model, the model certainly must swing towards that sample when it is included rather than excluded. I don’t think it has anything to do with some quirk of preprocessing during cross-validation. We see this sometimes using very simple preprocessing methods including row-wise methods (such as the derivative used here or sample normalization) that don’t change with the data split.
I suspect it has to do with the stability of the model at the given number of components. If there are two components in the model (with all the data) that have nearly the same co-variance values (variance captured in x times variance captured in y) then a small change in the data, such as leaving a small amount of it out, can cause the factors to rotate or come out in different order. Thus the model is quite different in the last factor or factors. This instability can lead to a “lucky guess” as to the predicted values on one or more of the left out sample sets.
As a test of this model instability theory the agreement between the calibration and cross-validation y-residuals is considered. Figure 5 shows the cross-validation residuals versus the calibration residuals for the 6 component model. The samples are colored by their T2 values. For comparison the residuals from the 7 component model are shown in Figure 6. It is clear that there is much better agreement between residuals in the 7 component model, which shows the usual overfit ratio greater than 1 behavior.
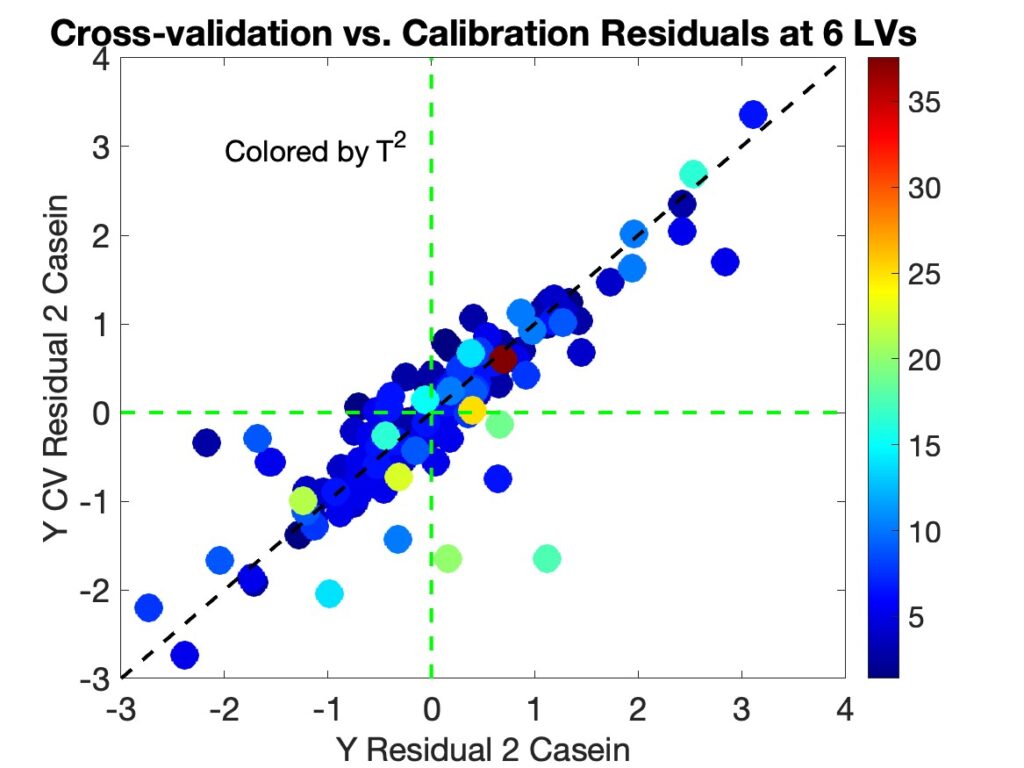
Figure 5. Cross-validation versus Calibration y-residuals for the 6 Component Casein Model Showing Substantial Differences Between Residuals, colored by T2 values.

Figure 6. Cross-validation versus Calibration y-residuals for the 7 Component Casein Model Showing Good Agreement Between Residuals, colored by T2 values.
It is interesting to note that samples with the largest difference in residuals for the 6 LV model tend to have high T2 values, as shown in Figure 5. Many of these samples also have relatively high Q-residual values as well, as shown in Figure 7. The fact that the samples that have the largest disagreement tend to be samples that could have a high impact on the model when included versus excluded suggests (to me at least) that model instability at the given number of factors is key to the overfit < 1 problem.
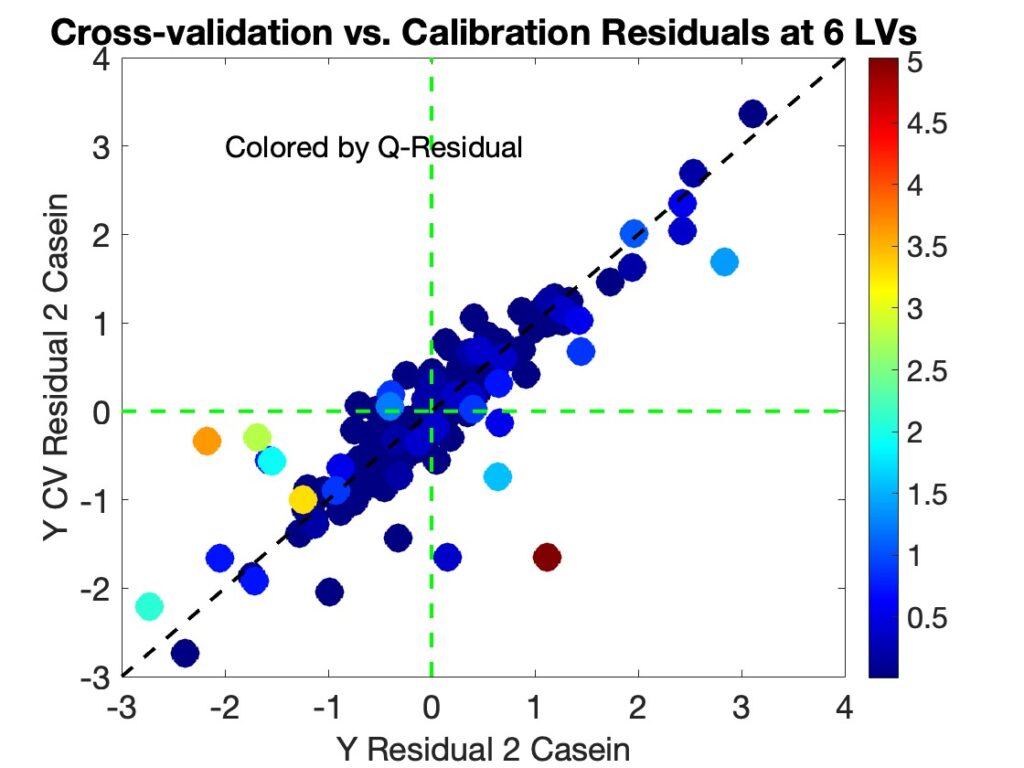
Figure 7. Cross-validation versus Calibration y-residuals for the 6 Component Casein Model Showing Substantial Differences Between Residuals, colored by Q-residual values.
There is much still to be done to fully investigate the cause of the RMSECV<RMSEC phenomenon. The practical question, of course, is what to do about it when it is observed. My suggestion is to simply not trust the model for the given number of factors. Therefore do not consider it as a candidate for final model selection. It’s fun to think you could get a model that predicts better than it fits but it likely the results of model instability that produces some good lucky guesses.
More to come!
BMW